Comparison Summary
This comparison report of SAS® Production Quality Analytics vs. KPI Dashboard is based on a specific set of business needs and context. The comparison uses 128 Cuspera insights based on peer reviews, case studies, testimonials, and expert opinions across 50+ sources.
Introducing SAS® Production Quality Analytics and KPI Dashboard
Different products excel in different areas, so the best platform for your business will depend on your specific needs and requirements.
SAS® Production Quality Analytics covers Social Media Management.
KPI Dashboard focuses on Social Media Management, Sales Incentive Management, Engagement Management, Loyalty Management.
Unsure which of these solutions is right for you? Our Cuspera AI engine can compare them based on your needs and specific to your industry and context. Get your personalized report today.


About
Powerful data management, predictive analytics and reporting technologies
KPI Dashboard - CSL Software Solutions
Financials
PRIVATE
NA
Business Need
Total Processes
(we found evidences for)
2
7
Total Goals
(we found evidences for)
0
0
Top Processes
Evidences indicate better relative satisfaction
Top Goals
Goals Achieved
Top Channels
Channels Used
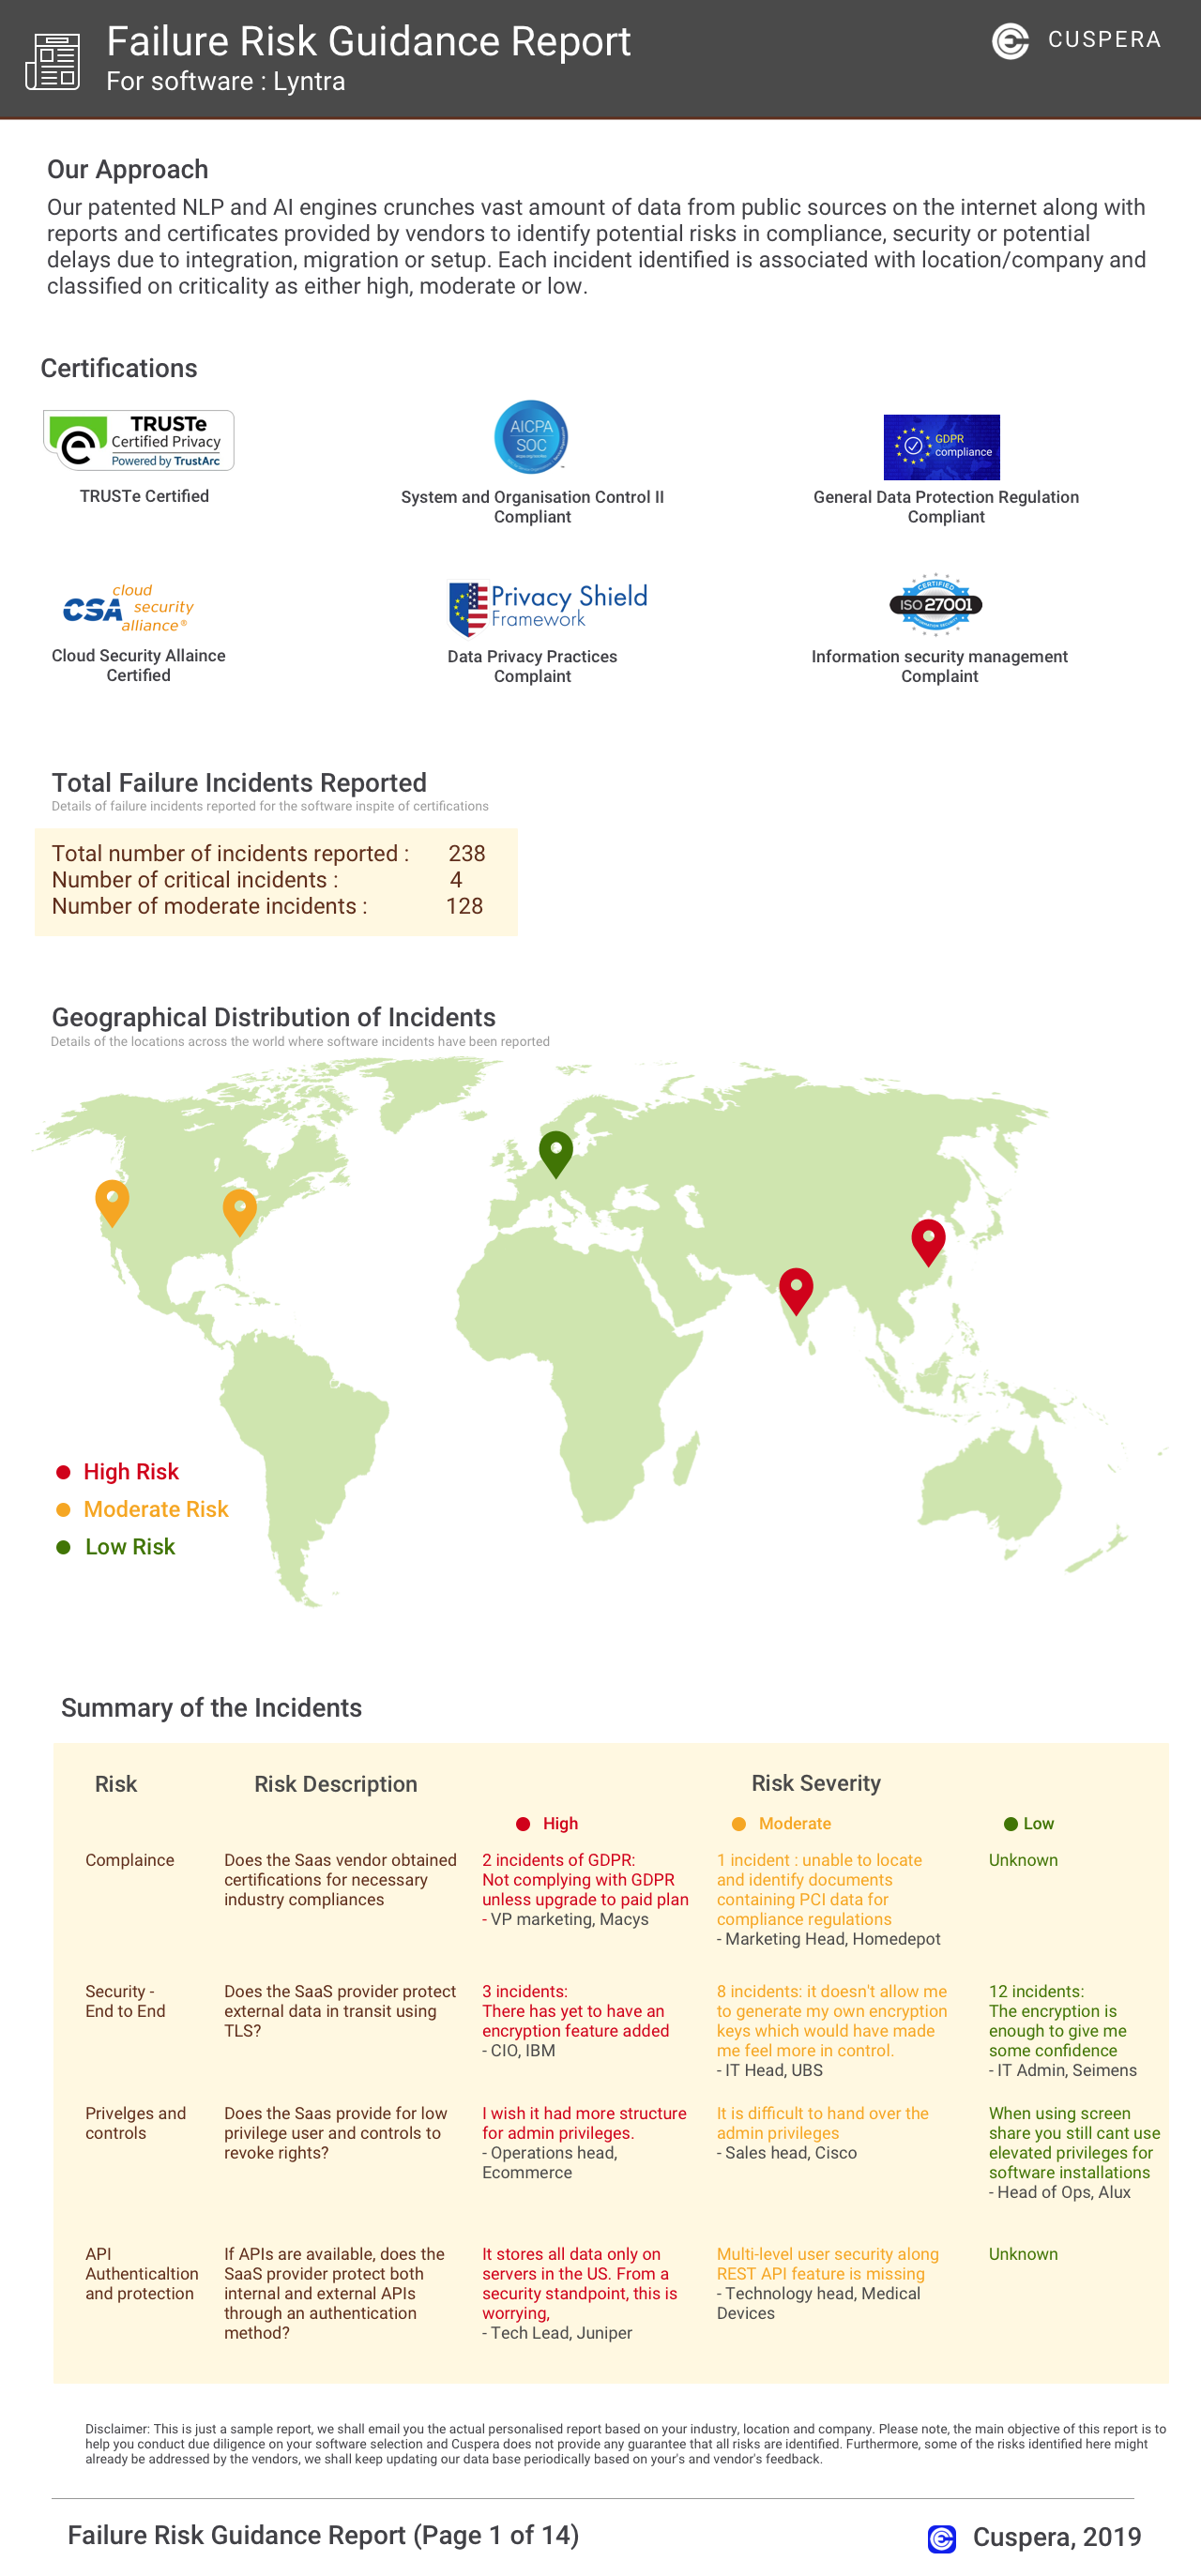
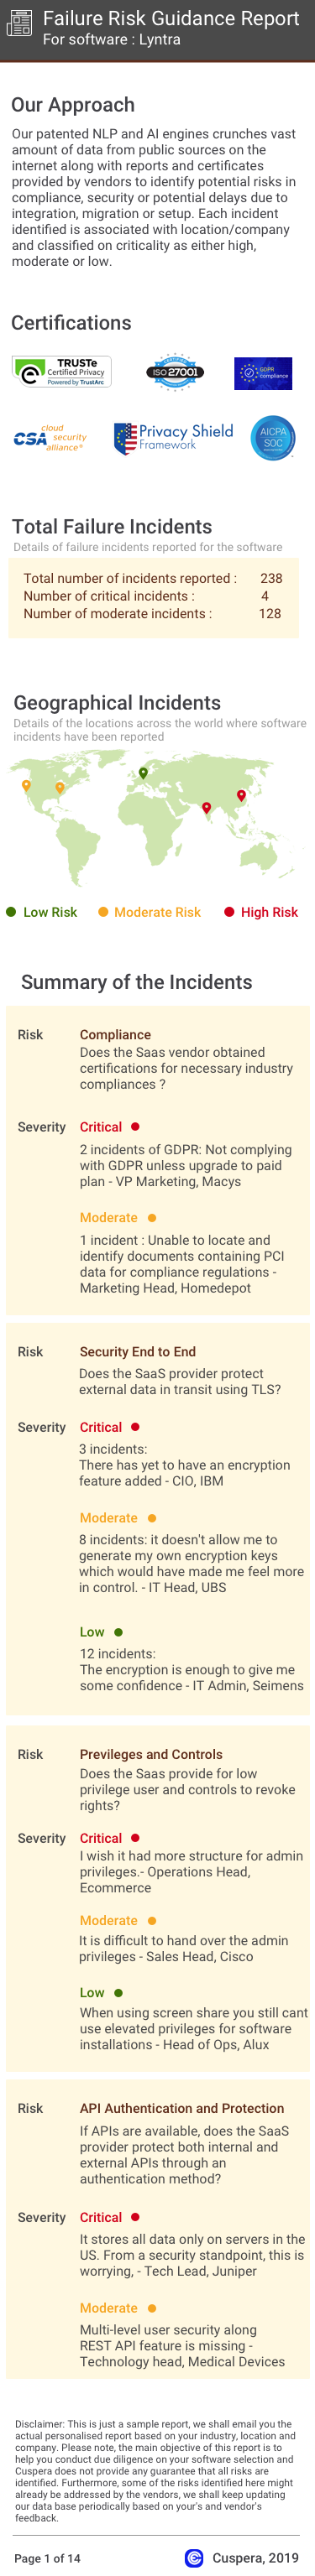
Failure Risk Guidance Security Report?
Compliance Risk
{{{rsh_C_1}}}
{{{rsh_C_1}}}
Security & Privacy Risk
{{{rsh_C_1}}}
{{{rsh_C_1}}}
Integration Risk
{{{rsh_C_1}}}
{{{rsh_C_1}}}
Migration Risk
{{{rsh_C_1}}}
{{{rsh_C_1}}}
IT and Other Capabilities
- Low
- Medium
- High