Metabase Overview

Metabase offers business intelligence, dashboards, and data visualization tools. It allows users to explore data with open-source, no-SQL solutions.

Use Cases

Customers recommend Competitive Intelligence, Lead Analytics, Products & Pricelist Management, as the business use cases that they have been most satisfied with while using Metabase.

Other use cases:

  • Social Media Analytics
  • Business Development
  • Training & Onboarding
  • Campaign Management
  • Sending & Publishing Communications
  • Collaboration
  • Lead Qualification: Technographic
See all use cases See less use cases

Business Priorities

Launch New Products and Improve Efficiency are the most popular business priorities that customers and associates have achieved using Metabase.

Other priorities:

  • Grow Market Share
See all business priorities See less business priorities

Metabase Use-Cases and Business Priorities: Customer Satisfaction Data

Metabase works with different mediums / channels such as E-Mail. Chat. Slack etc.

Metabase's features include Dashboard. and Metabase support capabilities include 24/7 Support, AI Powered, Phone Support, etc. also Metabase analytics capabilities include Analytics, and Custom Reports.

Reviews

"...Amazing tool for Business intelligence and visualization! ...." Peer review by Verified Reviewer, Computer & Network Security

Popular Business Setting

for Metabase

Top Industries

  • Financial Services
  • Internet
  • Computer & Network Security

Popular in

  • Small Business
  • Mid Market
  • Enterprise

Metabase is popular in Financial Services, Internet, and Computer & Network Security and is widely used by Small Business, Mid Market, and Enterprise.

Comprehensive Insights on Metabase Use Cases

What makes Metabase ideal for Competitive Intelligence?

How can Metabase enhance your Lead Analytics process?

How does Metabase address your Products & Pricelist Management Challenges?

How can Metabase enhance your Business Development process?

12+ more Business Use Cases

27 buyers and buying teams have used Cuspera to assess how well Metabase solved their business needs. Cuspera uses 559 insights from these buyers along with peer reviews, customer case studies, testimonials, expert blogs and vendor provided installation data to help you assess the fit for your specific business needs.

Case Studies

COMPANY INDUSTRY CASE STUDIES
Metabase case study
Computer Software
Computer Software
CASE STUDY Synctera

Synctera improved customer satisfaction and self-service analytics using Metabase, enhancing data access and insights capabilities for businesses.

Read More
Metabase case study
Computer Software
Computer Software
CASE STUDY Faros.ai

Faros.ai integrated Metabase into their SaaS product, enhancing analytics capabilities. This improved customer engagement and data insights, leading to a 50% increase in user interactions.

Read More

Frequently Asked Questions(FAQ)

for Metabase

What is Metabase used for?

Metabase is mainly used by its customers to Launch New Products and Improve Efficiency by Competitive Intelligence, Lead Analytics and Products & Pricelist Management .

Who uses Metabase?

Metabase is used by Financial Services, Internet and Computer & Network Security among other industries.

Where is Metabase located?

Metabase is headquartered at San Francisco, CA.
lightning

Peers used Metabase for competitive intelligence and lead analytics

Metabase Features

  • Low
  • Medium
  • High
FEATURE RATINGS AND REVIEWS
AI Powered

3.05/5 ★

Read Reviews (1)
Analytics

4.54/5 ★

Read Reviews (63)
Custom Reports

3.82/5 ★

Read Reviews (161)
CAPABILITIES RATINGS AND REVIEWS
AI Powered

3.05/5 ★

Read Reviews (1)
Analytics

4.54/5 ★

Read Reviews (63)
Custom Reports

3.82/5 ★

Read Reviews (161)

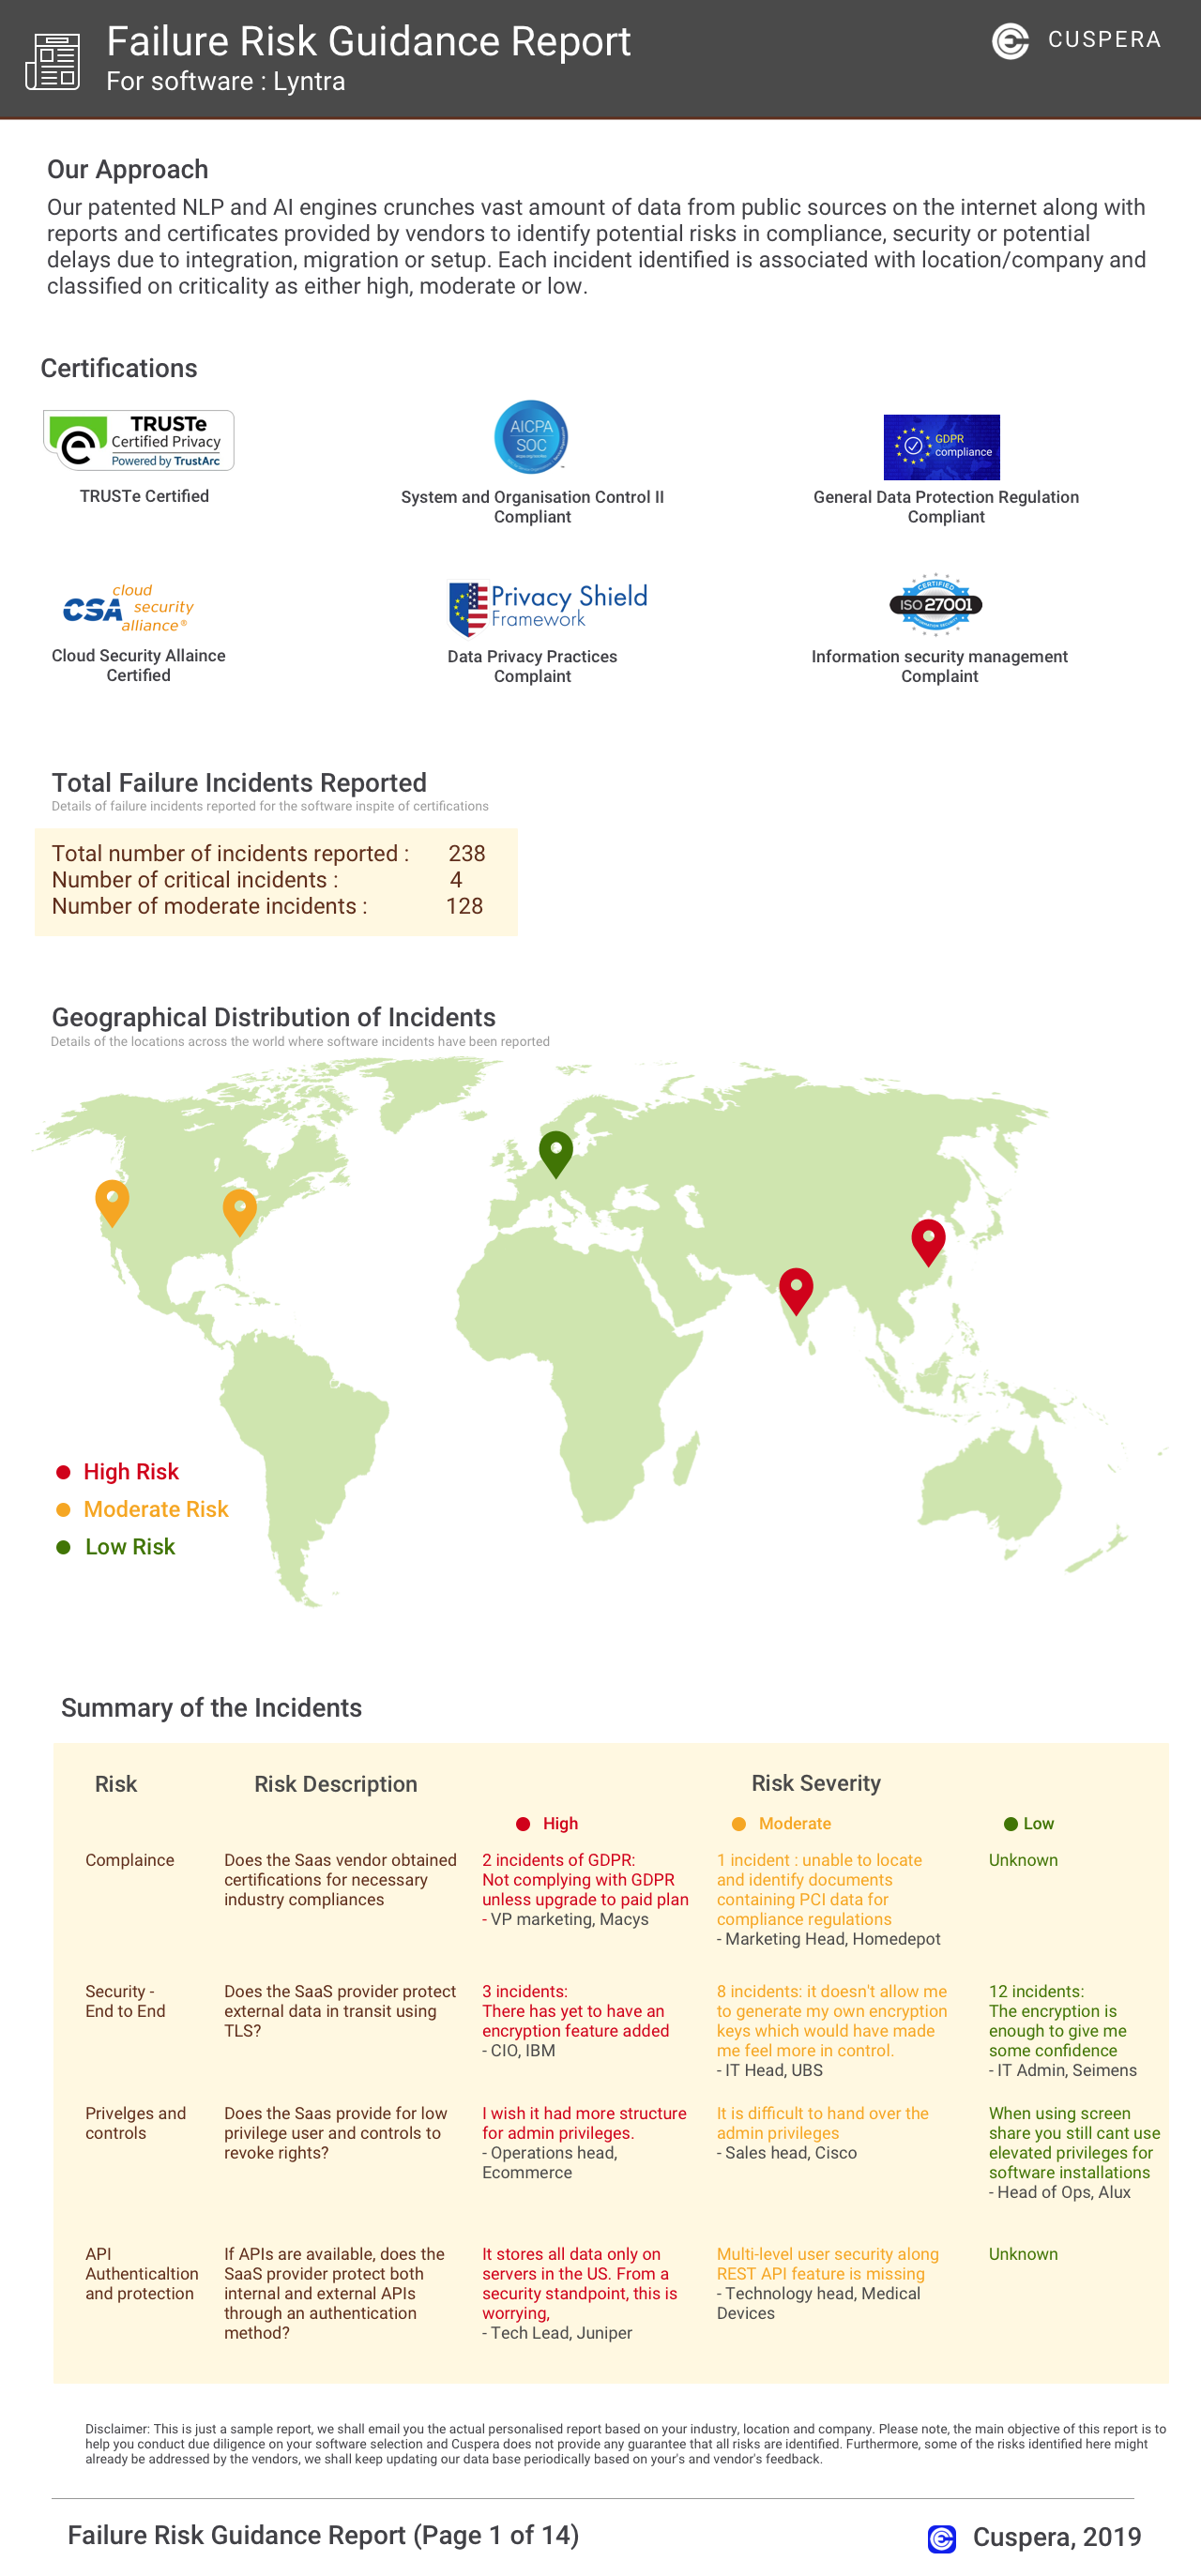
Software Failure Risk Guidance

?

for Metabase

Overall Risk Meter

Low Medium High

Top Failure Risks for Metabase

Metabase, Inc. News

Metabase Q secures $11M, expands platform with new mitigator feature - SiliconANGLE News

Metabase Q raises $11M and adds a new mitigator feature to its platform.

11/09/2024 - source

Metabase, Inc. Feeds

Metabase Q Raises $11M in Series A Extension Funding - FinSMEs

Metabase Q raised $11 million in Series A extension funding.

12/09/2024 - source

Set up a basic pipeline for log analysis

Choosing tools to clean, parse, and structure log data can be overwhelming (and expensive). But when you’re just getting started, you can get away with a simple setup for ad hoc analysis with a BI tool like Metabase. Here are a few best practices to follow for setting up a basic pipeline for analyzing logs.

Use a data connector tool as a shortcut for ingestion

Tools like Airbyte can quickly connect to your database and structure logs for you. Choose your logging source, like AWS CloudTrail, and connect it to a database, like Snowflake (a relatively easy, scalable, reasonable cost solution), or AWS Aurora Serverless Postgres(an easy, somewhat scalable, low-cost solution).

Other ETL tools, like Fivetran or Stitch, work in a similar vein. They use a connector to move log data from a source, like CloudTrail, to your database. You can also use an ETL tool and perform data modeling in tandem to do some of the heavier lifting for you.

Use a single cloud provider to keep everything under one roof

Google Cloud Logging connects with BigQuery so you can automatically ingest logs right into your data warehouse. AWS has multiple logging options, like CloudTrail or CloudWatch, that you can connect to one of their database options, like Postgres for RDS. Azure Monitor also has logging and storage capabilities.

Advanced use case: dump logs from multiple AWS services into an S3 bucket and query them with Athena

If you have a bit of experience with cloud services, like AWS, you can use an entire suite of cloud services to take logs from several different services and push them into one central location to prepare for analysis.

For example, push web server or application logs from your EC2 instances into an S3 bucket, along with your CloudTrail logs. Connect your S3 bucket to a querying tool, like Athena, so you can create a few tables to use for analysis. Once you have tables, you can connect to your analytics tool and create a troubleshooting dashboard, like one that maps EC2 events to CloudTrail incidents for root cause analysis.

Here’s some other AWS logging options that you can use with S3 and Athena:

  • CloudWatch: store application, system, or custom logs
  • RDS: store error, slow query, or transaction logs
  • Lambda: store lambda logs that contain execution details, error messages, and custom log statements
  • Elastic Load Balancer (ELB): store ELB logs that contain client IP address, request time, and response status code

If want to go a step further, you can connect Athena to dbt and learn how to write your own data transformations in SQL. dbt streamlines version control, deployment, and testing without having to run individual tools. However, we only recommend this setup if you’re familiar with data modeling and developer tooling.

Batch load logs for efficiency

You should batch load your logs into your data warehouse directly, or a storage option like S3, to avoid latency and resource consumption. Most cloud services offer a batch service where you can schedule and queue jobs. Note if you’re paying for a database or log storage, double-check the price of batch loading first as some cloud services charge per batch upload.

Use a database client library or connector for ingestion

Not having access to a connector tool is not an issue, but it may take more development work. Using an existing database client library or driver can help you ingest logs directly into storage / data warehouse at log time.

For example, Postgres has drivers, and MySQL has connectors. Use one of these to hook into your database without having to reinvent the wheel.

Make sure your logs include a timestamp, source, message, and log level

There are four areas we recommend to add to your log files to make log analysis smoother:

  • Timestamps: It’ll be easier to establish a sequence of events. Timestamps are especially important if you’re using an analytics tool to create dashboards for performance monitoring, or auditing and compliance.
  • Source: Like the service that created the log, but also which location/file/sub-service the logs are coming from. You can use the service field for troubleshooting, or just to gauge which resources are allocated to each service.
  • Log message: Keep messages clear and concise so you can understand each event. Reuse keywords so it’s easier to filter and find what you need during textual analysis.
  • Log level: You can filter on levels like ALERT and CRITICAL to get to the bottom of which log requires immediate investigation and response.

Additional best practices and ideas for log analysis

If you’re aiming for real-time log analysis, or advanced or frequent log analysis, log-specific tooling tends to be a better fit. If your team is already using an ELK stack, a tool like Grafana could fit the bill.

Here are a few additional resources you can use to make decisions when building out a small scale logging pipeline:

03/03/2024 - source

Embed a Metabase dashboard in Zendesk

One cool thing about Metabase is that you can embed a dashboard in the apps you use every day.

We recently embedded our customer dashboard right into Zendesk. Having this dashboard side-by-side with support tickets allows us to see customer information without having to switch between Metabase and Zendesk. We even passed a few filter parameters to automatically filter on the customer and organization in the dashboard, significantly speeding up how quickly we can troubleshoot issues.

The dashboard includes:

  • Account information: Customer name, when their account was created, if it was cancelled and when, subscription status, plan name
  • Support tier information: Support tier, whether their account is active
  • Deployment and Metabase version information: Deployment type, cloud provider, Metabase version number and last time they updated
  • Account details: Annual value, LTV, number of users, country
  • Cloud details: How many questions and dashboards the customer has, and link to their instance log
  • Contact information: Email, name, level of technical knowledge
  • Customer happiness or sentiment: Survey responses, CSAT responses, etc.
  • List of associated GitHub issues and tickets

Technically, you can embed a Metabase dashboard into any app that allows iframe embedding or allows third-party apps that support the use of embedding URLs. A few other platforms that you can test this out with are Salesforce, Jira, Stripe, and Shopify.

Here’s a quick walkthrough of how we embedded our customer dashboard in Zendesk.

Our setup: an interactive dashboard embedded in an iframe using a third-party app

  1. We used interactive embedding in this example. You can use public embedding to embed a dashboard, but for this instance, we needed to protect customer data as public embedding enables public links. It’s best to stick with interactive embedding if you’re in a similar position.

  2. We decided to use an iFrame app rather than build our own app. By going with a third-party app, we saved engineering resources and got to a working implementation faster. One downside: the logo for the app we went with, Customer360, is always visible. Not ideal, but not really an issue for our internal-facing use.

The iframe apps we considered

To get started, we narrowed down apps and made a list of their pros and cons:

  • Iframe Plus: $7 per instance, so it’s low price, but the con is there isn’t any support.
  • Zendesk Iframe: Free, but there was no ticket sidebar option, which is where we wanted the dashboard to live. E.g., the dashboard will only show up in organization view, not ticket view.
  • Customer360: $4 per agent, so it’s low price and the UI is easy-to-use. This is the app we went with.

Enable interactive embedding

Next, we enabled interactive embedding by going to Settings > Admin settings > Embedding. Click on Enable, and click on Interactive embedding.

We then grabbed the URL for our dashboard from Metabase and properly formatted it to use in the Customer360 app.

You’ll need to set the source attribute to your site URL. For example, http://metabase.yourcompany.com/dashboard/1.

Authorize Zendesk and Customer 360 URLs in Metabase

We also needed to authorize the following Zendesk URLs in Metabase. To do this, we navigated to Admin Settings > Settings > Embedding > Interactive > Authorized Origins and added the following URLs:

Zendesk URLs

  • https://*.zdusercontent.com
  • https://*.zndsk.com
  • https://*.zendesk.com

Customer 360 URL

  • https://*.myplaylist.io

Install the Customer 360 app and add your dashboard URL

Next, we installed the Customer 360 app and input our dashboard URL (with the source attribute set to our Metabase instance).

Show only the customer data you need by passing parameters in the URL to filters in your dashboard

You can pass values to your dashboard’s filters via parameterized URLs. For example, we pass both Organization and Ticket requester information, so now our dashboard automatically filters to show only the information we need about the customer and their organization.

The Customer 360 app lets you use the following parameters:

  • {{ticket.requester.email}}
  • {{ticket.requester.emails}} (comma-separated list of requester’s emails)
  • {{ticket.requester.external_id}}
  • {{ticket.requester.id}}
  • {{ticket.requester.custom_fields.<field_key>}}
  • {{ticket.organization.id}}
  • {{ticket.organization.external_id}}
  • {{ticket.organization.custom_fields.<field_key>}}
  • {{ticket.ticket_field_<field ID number>}}

See the setting a SQL variable docs for an example.

Customer 360 app settings in Zendesk

A small caveat about SSO

Metabase will ask you to sign in again if you refresh the Zendesk ticket page or add a new ticket. Also, you will need an active session in your Metabase to not be kicked out every time you enter the ticket sidebar. We got around this by setting our environment’s MB_SESSION_COOKIE_SAMESITE to none, as mentioned in the interactive embedding setup docs and environment variables docs.

Tidy up your dashboard view in Zendesk

Now, when we click on a ticket in Zendesk and the ticket sidebar pops up, our customer dashboard appears and is filtered down to the customer and their organization!

A Metabase dashboard embedded in the Zendesk ticket sidebar

We hid a few Metabase UI components, like headers or breadcrumbs, by setting header to false in the embedding URL. We did this to clean up the way our dashboard looks in-app.

There’s a list of examples of what else you can do in the showing or hiding Metabase UI components docs. Note that some of these feature may not work for certain dashboards as it depends on the components in the dashboard.

Check out other embedding projects

If you need inspiration, check out projects and feedback in our Github tracker. If you enter the repo manually in the future, just filter by label:Embedding/Interactive to get a full list of current embedding-related issues (click on closed to see resolved issues.)

25/02/2024 - source

Metabase, Inc. Profile

Company Name

Metabase, Inc.

Company Website

https://www.metabase.com/

HQ Location

San Francisco, CA

Employees

1-10

Social

Financials

SERIES A