Comparison Summary
This comparison report of Promo.com vs. Visual UGC powered by Stackla is based on a specific set of business needs and context. The comparison uses 3736 Cuspera insights based on peer reviews, case studies, testimonials, and expert opinions across 50+ sources.
Introducing Promo.com and Visual UGC powered by Stackla
Promo.com, Vimeo Video Editor, rocketium, etc., belong to a category of solutions that help Video Platform, whereas Visual UGC powered by Stackla, AspireIQ, Klear Influencer Marketing, etc., belong to a category of solutions that help Influencer Marketing. Different products excel in different areas, so the best platform for your business will depend on your specific needs and requirements.
Promo.com covers Advertisement with Video, Engagement Management with Video, Social Media Management with Social Media, Content Management with Video, etc.
Visual UGC powered by Stackla focuses on Content Management with Social Media, Engagement Management with User Generated Content, Communication Management with Social Media, Social Media Management with Social Media, etc.
"Love this tool. With all of the advertising stats pointing towards using video to get noticed, Promo just makes it so easy. It looks way too professional for my budget!! This is a good thing. " - Matt Cooper
"Consumers are increasingly distrustful of advertising and marketing, and user-generated content serves as a cut-through for brands to deliver content that feels the most authentic to people.” – Kate Flowers, Creative Solutions Manager " - Tourism NT
Unsure which of these solutions is right for you? Our Cuspera AI engine can compare them based on your needs and specific to your industry and context. Get your personalized report today.

 Visual UGC powered by Stackla
Focus area
Visual UGC powered by Stackla is better than Promo.com for
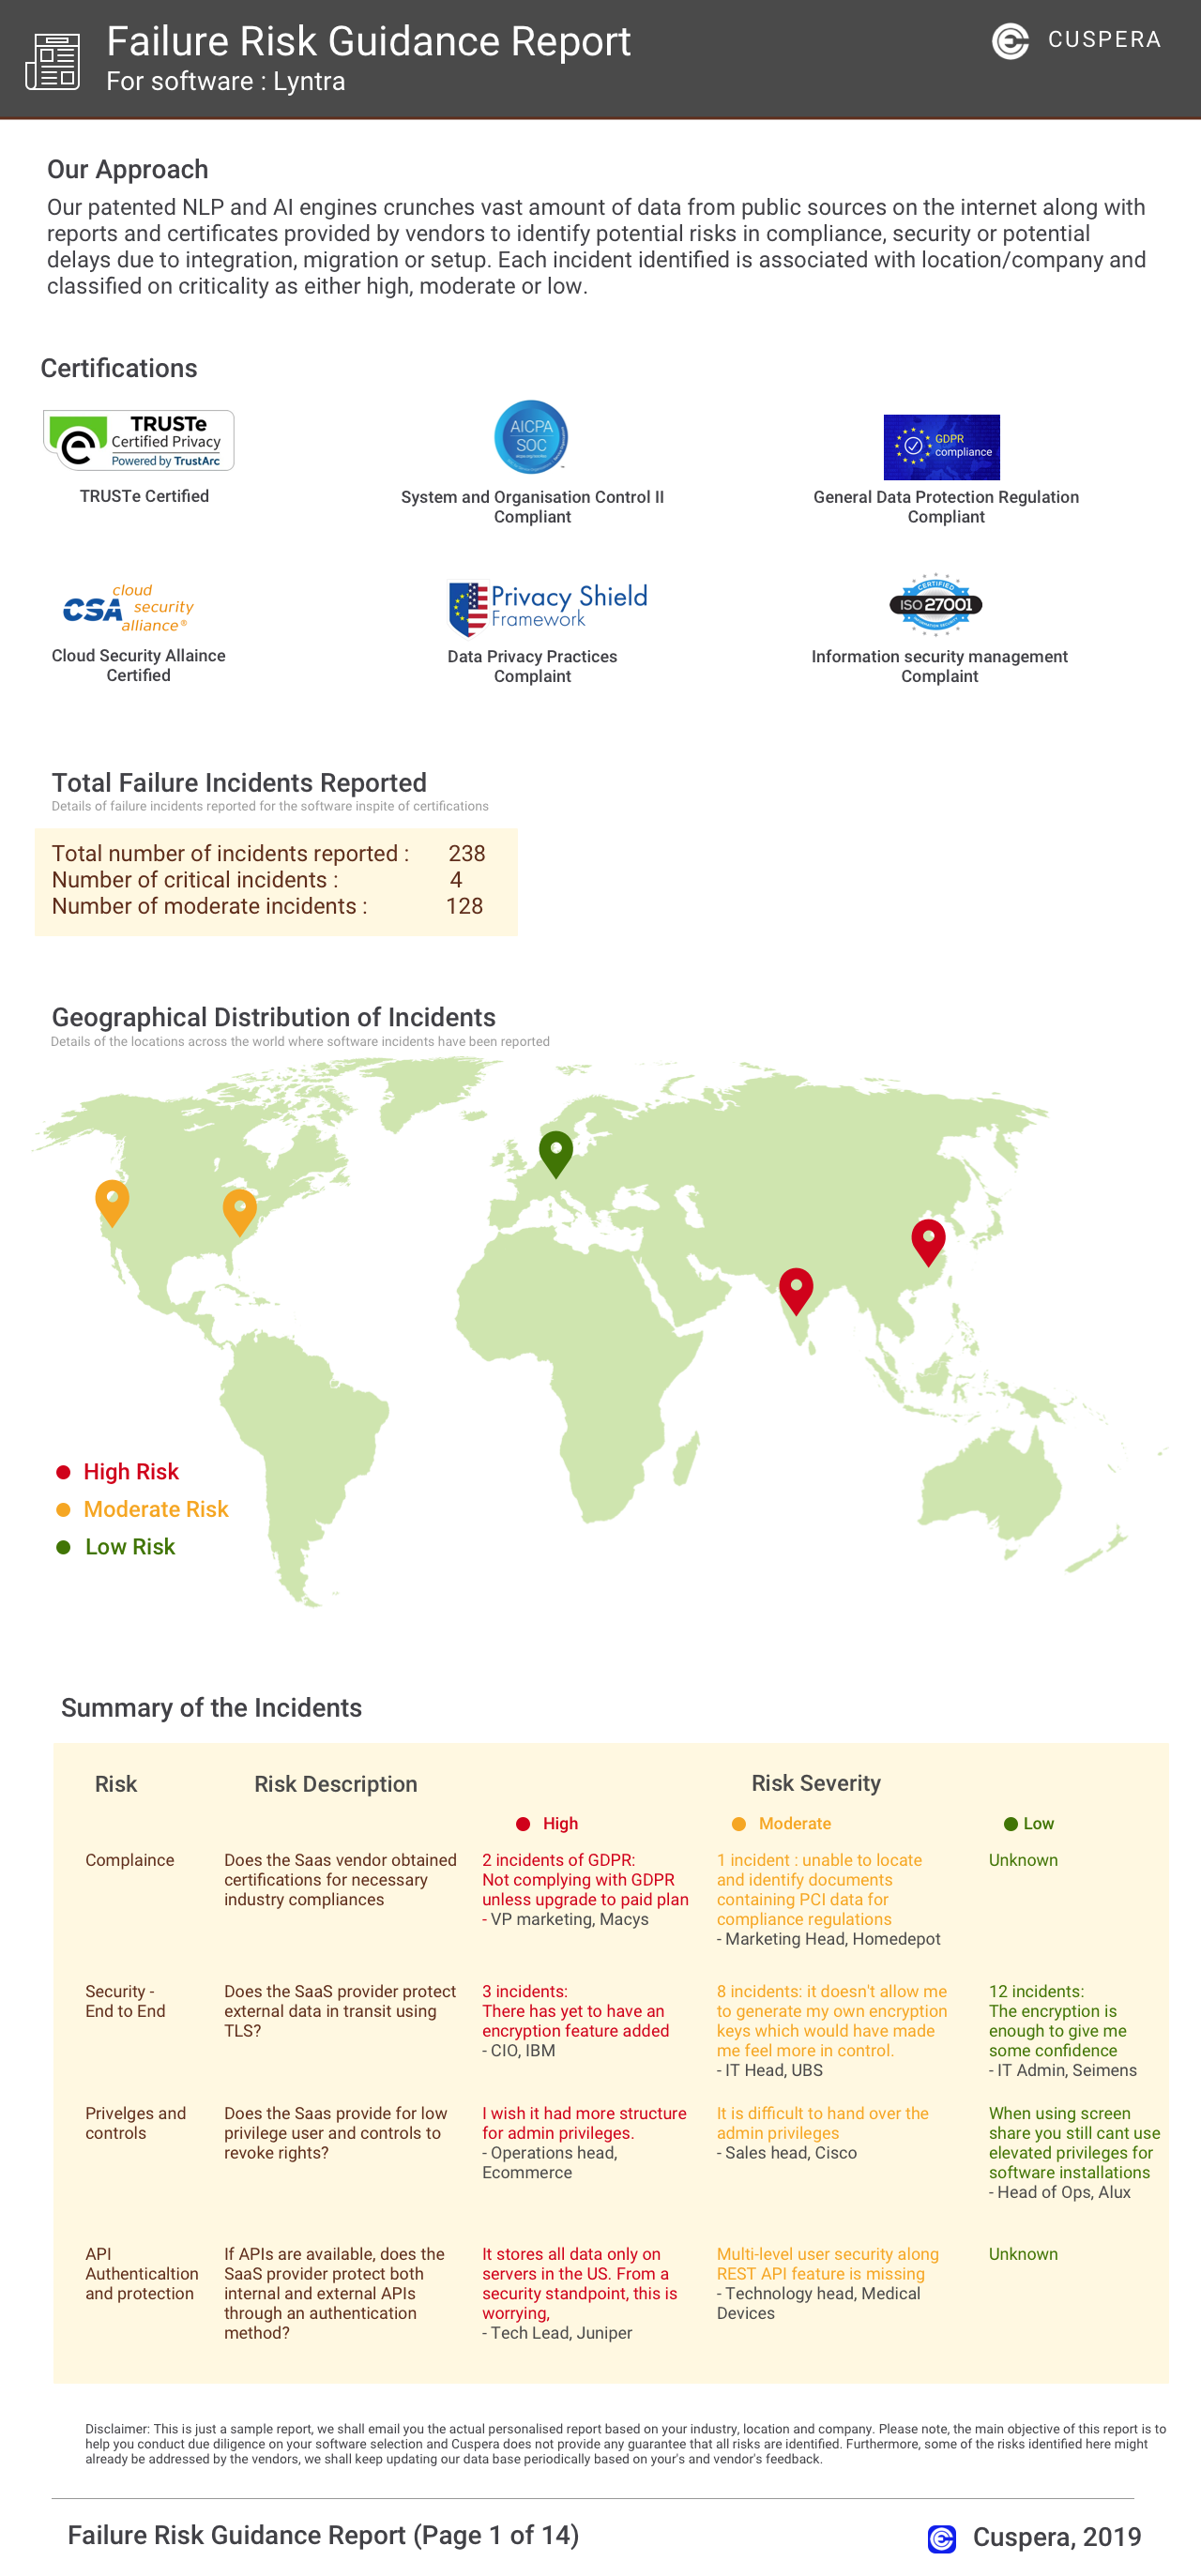
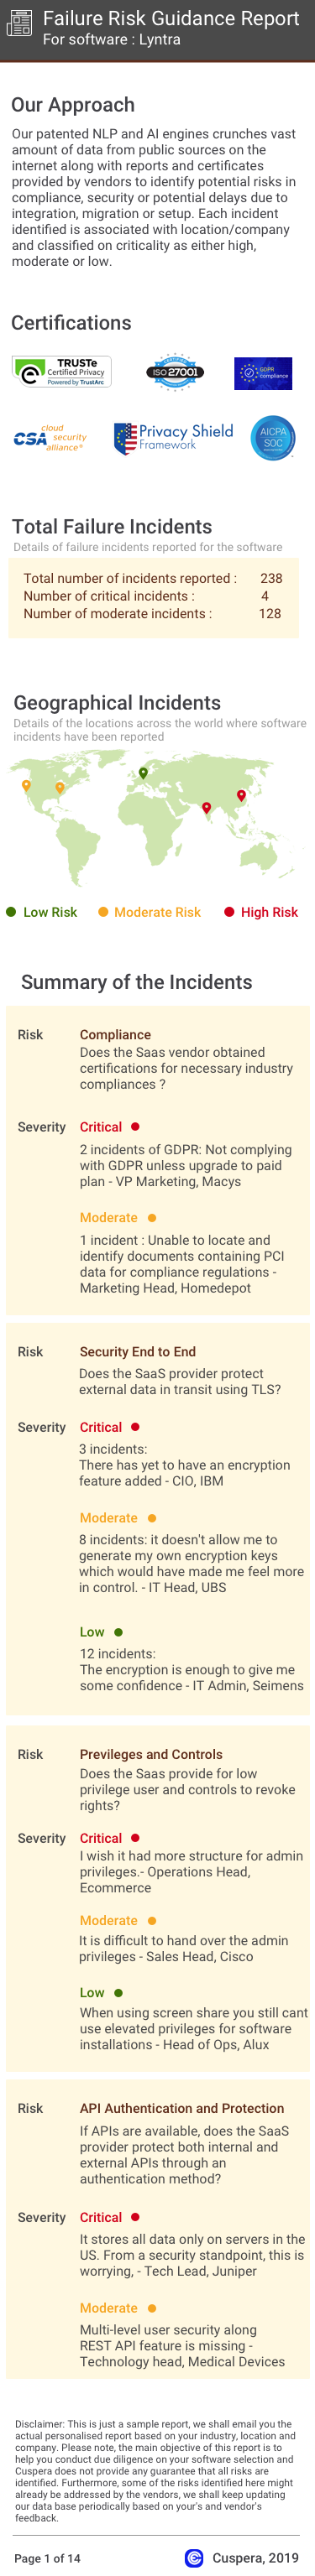
Software Failure Risk
About
Promo.com | Marketing Video Maker | Visual Content Creation Platform
Stackla |Discover, manage and display the most engaging visual content across all your marketing touchpoints
Financials
SERIES A
SERIES B
Business Need
Total Processes
(we found evidences for)
59
69
Total Goals
(we found evidences for)
12
15
Top Processes
Evidences indicate better relative satisfaction
Top Goals
Goals Achieved
-
Build brand awareness
-
Acquire customers
-
Improve digital and social presence
-
Scale best practices
-
Enhance customer relationships
-
Grow market share
-
Improve brand engagement
-
Enter new markets internationally or locally
-
Improve efficiency
-
Improve ROI
-
Increase sales & revenue
-
Launch new products
- See 9 more
-
Improve digital and social presence
-
Enhance customer relationships
-
Acquire customers
-
Build brand awareness
-
Improve brand engagement
-
Increase sales & revenue
-
Improve ROI
-
Improve efficiency
-
Improve internal communications
-
Scale best practices
-
Enter new markets internationally or locally
-
Grow market share
-
Launch new products
-
Reduce bounce
-
Improve stakeholder relations
- See 12 more
Top Channels
Channels Used
-
social media
-
user generated content
-
website
-
e-mail
-
mobile
-
offline
-
Facebook
-
Instagram
-
mobile app
-
chat
-
video
-
Slack
-
promotions
-
mass media
-
blogs
-
on premises
-
causes and charity
-
Facebook page
-
Twitter
-
trade shows
-
games
-
phone calls
-
newsletter
-
point of sale
-
print media
-
magazine
-
LinkedIn
-
television
-
omnichannel
-
coupons
- See 27 more
-
social media
-
user generated content
-
website
-
e-mail
-
mobile
-
offline
-
Facebook
-
Instagram
-
mobile app
-
chat
-
video
-
Slack
-
promotions
-
mass media
-
blogs
-
on premises
-
causes and charity
-
Facebook page
-
Twitter
-
trade shows
-
games
-
phone calls
-
newsletter
-
point of sale
-
print media
-
magazine
-
LinkedIn
-
television
-
omnichannel
-
coupons
- See 27 more
Failure Risk Guidance Security Report?
Compliance Risk
{{{rsh_C_1}}}
{{{rsh_C_1}}}
Security & Privacy Risk
{{{rsh_C_1}}}
{{{rsh_C_1}}}
Integration Risk
{{{rsh_C_1}}}
{{{rsh_C_1}}}
Migration Risk
{{{rsh_C_1}}}
{{{rsh_C_1}}}
IT and Other Capabilities
- Low
- Medium
- High