


DBxtra Overview
DBxtra transforms report creation with its ad-hoc reporting tool, specifically designed to streamline the process of generating and deploying reports. This software caters to business intelligence needs by allowing users to develop and launch reports and dashboards rapidly, often within minutes. Its intuitive interface enables users to design professional-grade reports without extensive training or technical expertise. DBxtra's automatic information deployment feature further enhances its utility, ensuring data is quickly accessible and actionable. This tool is ideal for businesses seeking efficient and user-friendly solutions for data reporting and visualization.
Use Cases
Customers recommend Competitive Intelligence, Engagement Management, Communication Management, as the business use cases that they have been most satisfied with while using DBxtra.
Business Priorities
Acquire Customers and Enhance Customer Relationships are the most popular business priorities that customers and associates have achieved using DBxtra.
DBxtra Use-Cases and Business Priorities: Customer Satisfaction Data
DBxtra works with different mediums / channels such as User Generated Content.
DBxtra's features include Dashboard, and Personalization. and DBxtra support capabilities include 24/7 Support, Chat Support, Email Support, etc. also DBxtra analytics capabilities include Custom Reports, and Analytics.
Reviews
"...It has really allowed our project to progress rapidly by providing a fast way to write custom reports and provide access to helpful business intelligence data on the fly...." Peer review by Bob Brown
Peer review evidence (same sources as the product rating summary)
"...I've found DBxtra far quicker to develop, test, and roll out to end users than either MS Business Intelligence or Oracle...." Peer review by Robert B Willsie, Management Consulting
"...Designing, deploying and managing interactive ad-hoc reports and dashboards has never been easier...." Peer review from Advisionario, S.A. de C.V.
"...Implementation was straightforward, and we're publishing complex dashboards within a couple of days...." Peer review by Chris H., IT Manager, Wholesale
DBxtra, Skyvia Platform, Phocas, ZAP Data Hub, Striim, etc., all belong to a category of solutions that help Business Intelligence. Each of them excels in different abilities. Therefore, determining the best platform for your business will depend on your specific needs and requirements.
DBxtra simplifies reporting tasks with its comprehensive modules, saving time on generating reports and dashboards. The ultimate reporting solution for efficient team performance.
Popular Business Setting
for DBxtra
Top Industries
- Hospital & Health Care
- Information Technology and Services
- Wholesale
Popular in
- Small Business
- Mid Market
- Enterprise
DBxtra is popular in Hospital & Health Care, Information Technology And Services, and Wholesale and is widely used by Small Business, Mid Market, and Enterprise.
DBxtra Customer wins, Customer success stories, Case studies
What solutions does DBxtra provide for Competitive Intelligence?
Why is DBxtra the best choice for Engagement Management?
What Are the key features of DBxtra for Communication Management?
What solutions does DBxtra provide for Proposal & Quote Management?
Frequently Asked Questions (FAQ)
What buyers ask before choosing DBxtra
Integrations What CRM integrations are available for DBxtra Report?
DBxtra Reporting Software offers various CRM integrations to enhance your reporting capabilities. While specific CRM integrations are not explicitly mentioned in the provided context, DBxtra is designed to connect seamlessly with external databases, which may include popular CRM systems like Salesforce and HubSpot. This allows users to pull data directly from their CRM into DBxtra for comprehensive reporting and analysis. By leveraging these integrations, businesses can create interactive reports and dashboards that reflect real-time data from their CRM, enabling better decision-making and insights. For detailed integration options, it is advisable to consult DBxtra's documentation or support resources.
Integrations How does DBxtra connect with Salesforce for reporting purposes?
DBxtra connects with Salesforce for reporting purposes by utilizing its robust data integration capabilities, allowing users to easily pull data from Salesforce into the DBxtra environment. This integration enables users to create comprehensive reports and dashboards that reflect real-time data from their Salesforce accounts without needing complex programming skills. To set up the connection, users typically configure a data source within DBxtra, specifying their Salesforce credentials and selecting the relevant objects or fields they wish to report on. Once connected, users can leverage DBxtra's intuitive reporting tools to design, deploy, and share interactive reports that enhance their business intelligence efforts, ultimately driving better decision-making based on accurate and timely data insights.
Integrations Can DBxtra integrate with HubSpot for data reporting and analysis?
Yes, DBxtra can integrate with HubSpot for data reporting and analysis, allowing users to leverage the powerful reporting capabilities of DBxtra alongside the customer relationship management features of HubSpot. This integration enables businesses to create comprehensive reports that combine data from HubSpot with other data sources, providing a holistic view of their operations. Users can easily design and deploy interactive dashboards that visualize key metrics from HubSpot, enhancing their ability to analyze customer interactions and sales performance. By utilizing DBxtra's user-friendly interface, even non-technical users can generate insightful reports without needing complex programming skills, making it an ideal solution for teams looking to streamline their reporting processes while maximizing the value of their HubSpot data.
Integrations What are the setup steps for configuring DBxtra with Marketo?
To configure DBxtra with Marketo, start by ensuring you have access to both platforms and the necessary permissions. First, log into your DBxtra account and navigate to the data source settings. Here, you will need to create a new data connection by selecting Marketo as the source. Enter your Marketo API credentials, which include the client ID and client secret, to establish a secure connection. Once the connection is established, you can define the specific data you want to pull from Marketo, such as leads or campaign performance metrics. After configuring the data source, use DBxtra's reporting tools to create and customize reports based on the imported Marketo data. Finally, test the integration to ensure data flows correctly between the two platforms, allowing you to leverage Marketo insights within DBxtra's reporting capabilities.
Integrations How does data flow between DBxtra and external data providers?
Data flow between DBxtra and external data providers is facilitated through seamless integration capabilities that allow users to connect to various data sources effortlessly. DBxtra enables real-time querying and reporting by establishing direct connections to external databases, ensuring that users can access the most current data available. This is achieved through the use of the XLReport Excel add-on, which allows users to pull data directly into Excel from these sources. Additionally, the Report Designer within DBxtra simplifies the process of creating database connections and queries, allowing users to filter and manipulate data as needed. This streamlined approach not only enhances the accuracy of reports but also significantly reduces the time spent on data reporting tasks, empowering users to make informed decisions based on up-to-date information.
Integrations Are there any limitations to the API access for DBxtra integrations?
DBxtra provides robust API access for integrations, allowing users to connect and interact with various data sources and reporting functionalities. However, there may be limitations based on the specific use cases and the type of subscription license held by the user. For instance, certain advanced features or extensive data queries might be restricted to higher-tier plans, which could affect the depth of integration capabilities. Additionally, users should be aware of any rate limits or data access restrictions that could impact the performance of their integrations. To fully understand the API limitations and ensure optimal use, it is advisable to consult the DBxtra documentation or reach out to their support team for detailed guidance tailored to your specific integration needs.
Features What does the Report Designer in DBxtra do?
The Report Designer in DBxtra is a powerful tool that simplifies the process of creating, managing, and deploying interactive reports and dashboards. It allows users, even those without technical expertise, to design sophisticated reports through an intuitive interface that requires no programming or complex SQL knowledge. With features like drag-and-drop functionality, users can easily connect to various databases, filter data, and customize reports to meet specific business needs. This capability not only enhances data analysis but also accelerates the reporting process, enabling teams to generate insights quickly and efficiently. By streamlining reporting tasks, the Report Designer empowers organizations to make informed decisions based on accurate and timely data.
Features How do I create a custom report using DBxtra?
To create a custom report using DBxtra, start by launching the Report Designer, which provides an intuitive interface for report creation. First, establish a connection to your desired database by selecting the appropriate data source. Next, utilize the drag-and-drop functionality to add data fields, filters, and visual elements to your report layout. You can customize the report's appearance by adjusting styles and formats to meet your business needs. Once your report design is complete, preview it to ensure accuracy, and then save or publish it for sharing with your team. DBxtra's user-friendly approach allows even non-technical users to generate sophisticated reports quickly, enhancing your business intelligence capabilities.
Features What features are available in the Dashboard Designer of DBxtra?
The Dashboard Designer in DBxtra offers a range of powerful features designed to simplify the creation of interactive dashboards. Users can leverage a "drag and drop" interface to easily build sophisticated dashboards without needing technical skills or programming knowledge. The tool allows for seamless integration with various databases, enabling users to connect and generate custom reports and dashboards quickly. Additionally, the Dashboard Designer is part of the broader Report Designer module, which enhances its capabilities for designing and deploying web-based dashboards. Users can also publish their dashboards online automatically, providing real-time insights into business data. Overall, these features empower non-technical users to gain actionable insights and streamline their reporting tasks effectively.
Features How can I automate report generation in DBxtra?
To automate report generation in DBxtra, you can utilize the Schedule Server feature, which allows you to set up recurring report delivery based on specific time intervals. First, access the Schedule Server within the DBxtra interface and create a new scheduling job. You can specify the report you want to automate, select the frequency of delivery (daily, weekly, monthly, etc.), and choose the recipients who will receive the reports. Additionally, you can customize the report format and delivery method, ensuring that your team receives the necessary insights without manual intervention. This automation not only saves time but also ensures consistent and reliable report delivery, allowing your team to focus on data analysis rather than report generation.
Features What is the process for inserting live data into Excel from DBxtra?
Inserting live data into Excel from DBxtra is a straightforward process designed to enhance your reporting capabilities. First, ensure you have the DBxtra software installed and connected to your desired data source. Open Excel and utilize the XLReport add-on, which allows you to connect to almost any external database. Once connected, you can insert a live, real-time dataset by selecting the relevant data and choosing the option to insert it into your Excel sheet. This will create a dynamic link, enabling you to refresh the data with a simple click of the Refresh button, ensuring your reports are always up-to-date. This integration not only streamlines data analysis but also enhances report accuracy, making it an invaluable tool for business intelligence.
Features How do I use the query builder feature in DBxtra?
To use the query builder feature in DBxtra, start by accessing the Report Designer within the software. Once there, select the data source you wish to query, and then navigate to the query builder interface. Here, you can utilize the intuitive drag-and-drop functionality to add tables and fields to your query. You can also set filters and conditions to refine your data selection. After constructing your query, you can preview the results to ensure accuracy. Finally, save your query and integrate it into your reports or dashboards as needed. This feature empowers non-technical users to create complex queries without requiring SQL knowledge, streamlining the reporting process and enhancing data analysis capabilities.
ROI & pricing What measurable business value can DBxtra provide for my organization?
DBxtra provides significant measurable business value by enabling organizations to create and share interactive business intelligence reports and dashboards quickly and efficiently. With its user-friendly interface, non-technical users can generate customized reports without needing complex SQL or programming skills, which reduces the time spent on report generation and allows for real-time data access. This streamlined reporting process enhances decision-making capabilities, as stakeholders can easily visualize and analyze data to identify trends and insights. Additionally, DBxtra's ability to deploy reports across various platforms ensures that teams can collaborate effectively, leading to improved operational efficiency and informed strategic planning. Overall, DBxtra empowers organizations to leverage their data more effectively, driving better business outcomes.
ROI & pricing How does DBxtra improve ROI through cost savings in reporting processes?
DBxtra improves ROI through cost savings in reporting processes by significantly reducing the time and resources required to generate reports and dashboards. Its user-friendly interface empowers non-technical users to create and manage interactive business intelligence reports without needing complex SQL or programming skills, which minimizes the reliance on specialized IT staff. This streamlined approach not only accelerates report generation but also enhances productivity, allowing teams to focus on strategic decision-making rather than manual reporting tasks. Additionally, DBxtra's ability to connect to various databases and automate report deployment further cuts down operational costs, leading to more efficient use of resources. By simplifying the reporting process, businesses can achieve faster insights and better data-driven decisions, ultimately enhancing their overall financial performance.
ROI & pricing What are the different pricing plans available for DBxtra, and what do they include?
DBxtra offers a variety of pricing plans tailored to meet different business needs, although specific pricing details are not provided in the available context. Typically, these plans may include features such as access to the Report Designer and Dashboard Designer, which enable users to create and manage reports and dashboards without requiring technical skills. Additionally, a subscription license to Developer Express Inc.’s Universal Subscription is included with a new DBxtra license, allowing users to connect to databases and generate custom reports. For precise pricing information and to explore the features included in each plan, it is recommended to visit the DBxtra website or contact their support team for personalized assistance.
ROI & pricing What is the total cost of ownership for implementing DBxtra in a business environment?
The total cost of ownership (TCO) for implementing DBxtra in a business environment includes several components. First, there is the initial licensing fee, which varies based on the subscription model chosen, as DBxtra requires an active subscription license to Developer Express Inc.’s Universal Subscription. Additionally, businesses should consider costs related to training staff to use the software effectively, as well as potential expenses for ongoing support and maintenance. While DBxtra is designed for non-technical users, some investment in training may be necessary to maximize its capabilities. Furthermore, organizations should account for any infrastructure upgrades needed to support the software, such as database connections and server requirements. Overall, evaluating these factors will provide a clearer picture of the TCO for DBxtra in your specific business context.
ROI & pricing How quickly can I expect to see value from using DBxtra after implementation?
After implementing DBxtra, users can expect to see value almost immediately, often within days. The software is designed for non-technical users, allowing them to create and share interactive business intelligence reports and dashboards without needing complex SQL or programming skills. With its intuitive interface and features like the Dashboard Designer, users can quickly build sophisticated dashboards and deploy them to the web with ease. Additionally, the trial version provides access to sample reports and the ability to connect to databases, enabling users to generate their own reports right away. This streamlined approach significantly reduces the time spent on report generation, allowing businesses to gain insights and make data-driven decisions faster than ever.
ROI & pricing What are the potential revenue impacts of using DBxtra for data analysis and reporting?
Using DBxtra for data analysis and reporting can significantly impact revenue by enhancing decision-making processes and operational efficiency. The software empowers non-technical users to create and share interactive business intelligence reports and dashboards quickly, reducing the time spent on report generation and allowing teams to focus on strategic initiatives. By providing real-time data access and customizable reporting capabilities, DBxtra enables businesses to identify trends, optimize resource allocation, and respond swiftly to market changes. This agility can lead to improved customer satisfaction and retention, ultimately driving revenue growth. Additionally, the ability to perform ad-hoc reporting allows organizations to uncover new revenue opportunities and make data-driven decisions that align with their business goals.
Capabilities Can DBxtra generate ad-hoc reports quickly?
Yes, DBxtra can generate ad-hoc reports quickly and efficiently, making it an ideal solution for businesses that require fast and flexible reporting capabilities. The software is designed for non-technical users, allowing them to create and deploy sophisticated custom reports and dashboards without needing complex SQL or programming skills. With its intuitive interface, users can easily connect to various databases, filter data, and generate reports in minutes. This streamlined process not only saves time but also enhances the accuracy of data analysis, enabling businesses to make informed decisions based on real-time insights. Overall, DBxtra empowers organizations to elevate their reporting capabilities and respond swiftly to changing business needs.
Capabilities Does DBxtra support real-time data integration for reporting?
Yes, DBxtra supports real-time data integration for reporting, allowing users to effortlessly insert and update live, real-time connected datasets into their reports. This capability ensures that users can access the most current data with just a click of the Refresh button, enhancing the accuracy and timeliness of their reports. By utilizing DBxtra's features, non-technical users can create interactive business intelligence reports and dashboards without needing complex SQL or programming skills. This real-time integration not only streamlines the reporting process but also empowers organizations to make informed decisions based on up-to-date information, ultimately improving overall business performance.
Capabilities Can DBxtra create interactive dashboards for data visualization?
Yes, DBxtra can create interactive dashboards for data visualization. The DBxtra Dashboard Designer is specifically designed to enable users to build sophisticated and complex interactive dashboards with ease, utilizing a “drag and drop” interface. This feature allows non-technical users to design, deploy, and manage dashboards without needing extensive programming or SQL knowledge. By leveraging DBxtra's capabilities, businesses can gain deep insights and actionable views of their data, enhancing decision-making processes. Additionally, the dashboards can be automatically published to the web, making it easy to share insights across teams. Overall, DBxtra empowers organizations to visualize their data effectively, driving better business outcomes.
Capabilities Does DBxtra provide automated insights for data analysis?
DBxtra does not explicitly mention providing automated insights for data analysis; however, it offers powerful reporting and dashboard capabilities that empower users to generate and share interactive business intelligence reports without needing complex programming skills. The software simplifies the process of creating custom reports and dashboards, allowing users to analyze data effectively. While it streamlines report generation and enhances data visualization, the focus is more on user-driven reporting rather than fully automated insights. For businesses seeking automation in data analysis, they might consider integrating DBxtra with other BI tools or platforms that specialize in automated analytics, such as Tableau or Power BI, to complement its reporting features.
Capabilities Can DBxtra handle large datasets for complex reporting needs?
Yes, DBxtra is designed to handle large datasets effectively, making it suitable for complex reporting needs. Its robust architecture allows users to connect to various databases and manage extensive data without requiring advanced technical skills. The software simplifies the process of creating and deploying reports, enabling users to generate sophisticated business intelligence reports and dashboards quickly. With features like the Report Designer and Dashboard Designer, users can easily filter and visualize large amounts of data, ensuring that they can derive meaningful insights efficiently. Additionally, DBxtra's ability to publish interactive reports to the web enhances accessibility and collaboration, making it a powerful tool for organizations that need to analyze and report on large datasets.
Capabilities Does DBxtra offer compliance management features for data governance?
DBxtra primarily focuses on providing business intelligence and reporting solutions, enabling users to create and share interactive reports and dashboards without requiring technical skills. While it excels in data reporting and visualization, the context does not explicitly mention compliance management features specifically designed for data governance. However, the ability to generate customizable reports and access real-time data can indirectly support compliance efforts by allowing organizations to monitor and report on data usage and access. For businesses seeking dedicated compliance management tools, it may be beneficial to explore specialized software that focuses on data governance, such as Collibra or Informatica, which are designed to ensure compliance with regulations and standards.
Use cases How can SDRs use DBxtra to streamline their reporting tasks and improve lead tracking?
Sales Development Representatives (SDRs) can leverage DBxtra to streamline their reporting tasks and enhance lead tracking by utilizing its user-friendly interface to create customized reports and dashboards without needing technical skills. With DBxtra, SDRs can quickly generate real-time reports that provide insights into lead status, conversion rates, and engagement metrics, allowing them to make data-driven decisions. The software's ad-hoc reporting capabilities enable SDRs to filter and analyze data on the fly, ensuring they can track leads effectively and respond promptly to opportunities. Additionally, the ability to share interactive reports with team members fosters collaboration and keeps everyone aligned on lead management strategies, ultimately improving overall sales performance.
Use cases What are the best practices for marketers to create ad-hoc reports using DBxtra for campaign analysis?
To create effective ad-hoc reports using DBxtra for campaign analysis, marketers should follow several best practices. First, clearly define the objectives of the report to ensure it aligns with campaign goals. Utilize DBxtra's intuitive interface to connect to relevant data sources and leverage its drag-and-drop features for easy report design. Incorporate key performance indicators (KPIs) that matter most to your campaign, such as conversion rates and engagement metrics, to provide actionable insights. Regularly update and refine reports based on feedback and changing campaign dynamics to maintain relevance. Finally, share reports with stakeholders using DBxtra's deployment features to facilitate collaboration and informed decision-making. By adhering to these practices, marketers can maximize the value of their ad-hoc reporting efforts.
Use cases In what scenarios should RevOps teams implement DBxtra for data governance and compliance management?
RevOps teams should implement DBxtra for data governance and compliance management in scenarios where they require streamlined reporting and real-time data access to ensure adherence to regulatory standards. DBxtra's user-friendly interface allows non-technical users to create customizable reports and dashboards, making it easier to monitor compliance metrics and data integrity. Additionally, its ability to integrate with SQL Server and other databases enhances data management capabilities, ensuring that all relevant data is accurately captured and reported. By utilizing DBxtra, RevOps teams can automate manual reporting processes, reduce the risk of errors, and maintain a clear audit trail, which is essential for compliance with industry regulations. This ultimately leads to improved decision-making and operational efficiency within the organization.
Use cases How can sales leaders leverage DBxtra to generate real-time sales performance dashboards?
Sales leaders can leverage DBxtra to generate real-time sales performance dashboards by utilizing its intuitive Dashboard Designer, which allows for easy creation and deployment of interactive dashboards without requiring technical skills. To get started, sales leaders should first connect their sales data sources to DBxtra, enabling access to real-time data. Next, they can use the drag-and-drop interface to design custom dashboards that visualize key performance indicators, such as sales targets, conversion rates, and revenue trends. By automating the reporting process, DBxtra ensures that sales leaders have up-to-date insights at their fingertips, facilitating informed decision-making and strategic planning. Additionally, the ability to publish these dashboards online allows for easy sharing with team members and stakeholders, enhancing collaboration and transparency in sales performance tracking.
Use cases What workflows can benefit from using DBxtra's automated insights for financial reporting and budgeting?
DBxtra's automated insights can significantly enhance workflows related to financial reporting and budgeting by streamlining data collection, analysis, and presentation. Users can automate the generation of financial reports, allowing for real-time data access and reducing the time spent on manual reporting tasks. This capability is particularly beneficial for budgeting processes, as it enables teams to quickly analyze historical data, forecast future trends, and adjust budgets accordingly. Additionally, DBxtra's intuitive dashboard design allows stakeholders to visualize key financial metrics at a glance, facilitating informed decision-making. By eliminating the need for complex SQL or programming skills, DBxtra empowers non-technical users to create customized reports and dashboards, ultimately improving collaboration and efficiency in financial workflows.
Use cases How can non-technical users adopt DBxtra to simplify their reporting processes across different departments?
Non-technical users can easily adopt DBxtra to simplify their reporting processes by leveraging its intuitive interface designed specifically for ease of use. To get started, users can download the fully operational trial version, which provides access to sample reports and dashboards, allowing them to familiarize themselves with the software. The drag-and-drop functionality in the Dashboard Designer enables users to create interactive dashboards without needing programming skills or SQL knowledge. Additionally, DBxtra's Report Designer simplifies the process of connecting to various databases and generating reports quickly. By utilizing these features, teams across different departments can efficiently create, manage, and share reports, significantly reducing the time and effort traditionally required for reporting tasks. This empowers users to focus on data analysis rather than technical complexities, enhancing overall productivity.
Alternatives What are the best alternatives to DBxtra for report generation?
When considering alternatives to DBxtra for report generation, two notable options are Tableau and Looker. Tableau is renowned for its powerful data visualization capabilities, allowing users to create interactive and shareable dashboards, making it ideal for businesses that prioritize visual analytics. On the other hand, Looker offers a robust data exploration platform that integrates seamlessly with various databases, enabling users to generate custom reports and insights through a user-friendly interface. Both tools cater to different reporting needs and user preferences, with Tableau focusing on visual storytelling and Looker emphasizing data-driven decision-making. Ultimately, the choice between these alternatives will depend on your specific reporting requirements and the level of technical expertise within your team.
Alternatives How does DBxtra compare to Tableau in terms of reporting capabilities?
DBxtra and Tableau both offer robust reporting capabilities, but they cater to different user needs and technical expertise. DBxtra is designed for non-technical users, allowing them to create and share interactive reports and dashboards without needing complex SQL or programming skills. Its intuitive interface simplifies ad-hoc reporting, making it accessible for teams that require quick and efficient report generation. In contrast, Tableau is a more advanced business intelligence tool that excels in data visualization and analytics, often requiring a steeper learning curve and technical knowledge. While Tableau provides powerful features for in-depth data analysis, DBxtra focuses on ease of use and rapid deployment, making it ideal for organizations looking for straightforward reporting solutions without extensive training. Ultimately, the choice between DBxtra and Tableau depends on the specific reporting needs and technical capabilities of the users.
Alternatives What are the key differences between DBxtra and Looker for business intelligence?
DBxtra and Looker are both powerful business intelligence tools, but they cater to different needs and preferences. DBxtra is known for its user-friendly interface and strong reporting capabilities, making it ideal for businesses that prioritize ease of use and quick report generation. It offers customizable dashboards and supports various data sources, which can be beneficial for organizations looking for flexibility. In contrast, Looker excels in data exploration and visualization, providing advanced analytics features and a robust modeling layer that allows users to create complex queries and insights. Looker is particularly suited for data-driven companies that require deep analytical capabilities and collaboration features. Ultimately, the choice between DBxtra and Looker will depend on your organization's specific business intelligence needs and the level of complexity you require in your data analysis.
Alternatives Is Power BI a better choice than DBxtra for data visualization?
When comparing Power BI and DBxtra for data visualization, both tools offer unique strengths tailored to different business needs. Power BI is widely recognized for its robust integration capabilities with Microsoft products, extensive data modeling features, and a user-friendly interface that supports a wide range of data sources. It excels in creating interactive reports and dashboards, making it a popular choice for organizations already using Microsoft ecosystems. On the other hand, DBxtra specializes in creating sophisticated and complex interactive dashboards with a focus on ease of use through its drag-and-drop functionality. It also allows for automatic web publishing, which can be advantageous for businesses looking to share insights quickly. Ultimately, the choice between Power BI and DBxtra depends on your specific requirements, existing software environment, and the complexity of the visualizations you need.
Alternatives What unique strengths does DBxtra have over its competitors in the reporting software market?
DBxtra stands out in the reporting software market due to its user-friendly interface that empowers non-technical users to create and share interactive business intelligence reports and dashboards without needing complex SQL or programming skills. This accessibility allows organizations to streamline their reporting processes significantly, reducing the time spent on report generation. Additionally, DBxtra's focus on continuous improvement and customer satisfaction ensures that users benefit from regular updates and enhancements. Unlike some competitors, DBxtra offers a comprehensive suite of features, including ad-hoc reporting tools and a Dashboard Designer that simplifies the creation of sophisticated dashboards. This combination of ease of use, robust functionality, and a commitment to customer support positions DBxtra as a compelling choice for businesses looking to enhance their reporting capabilities.
Alternatives Why should I consider switching from DBxtra to another reporting tool?
Considering a switch from DBxtra to another reporting tool may be beneficial if your organization requires advanced features or specific integrations that DBxtra does not offer. For instance, tools like Tableau and Looker provide robust data visualization capabilities and may be better suited for complex analytical needs. Additionally, if your team has technical expertise, you might find that platforms like Power BI offer more customization options and deeper integration with Microsoft products. However, if ease of use and quick report generation are your primary concerns, DBxtra excels in empowering non-technical users to create reports without needing programming skills. Ultimately, the decision should be based on your specific reporting requirements, team capabilities, and the desired level of complexity in your data analysis.
DBxtra Competitors


DBxtra Features
- Low
- Medium
- High
| FEATURE | RATINGS AND REVIEWS |
|---|---|
| Custom Reports | Read Reviews (274) |
| Analytics | Read Reviews (23) |
| CAPABILITIES | RATINGS AND REVIEWS |
|---|---|
| Custom Reports | Read Reviews (274) |
| Analytics | Read Reviews (23) |
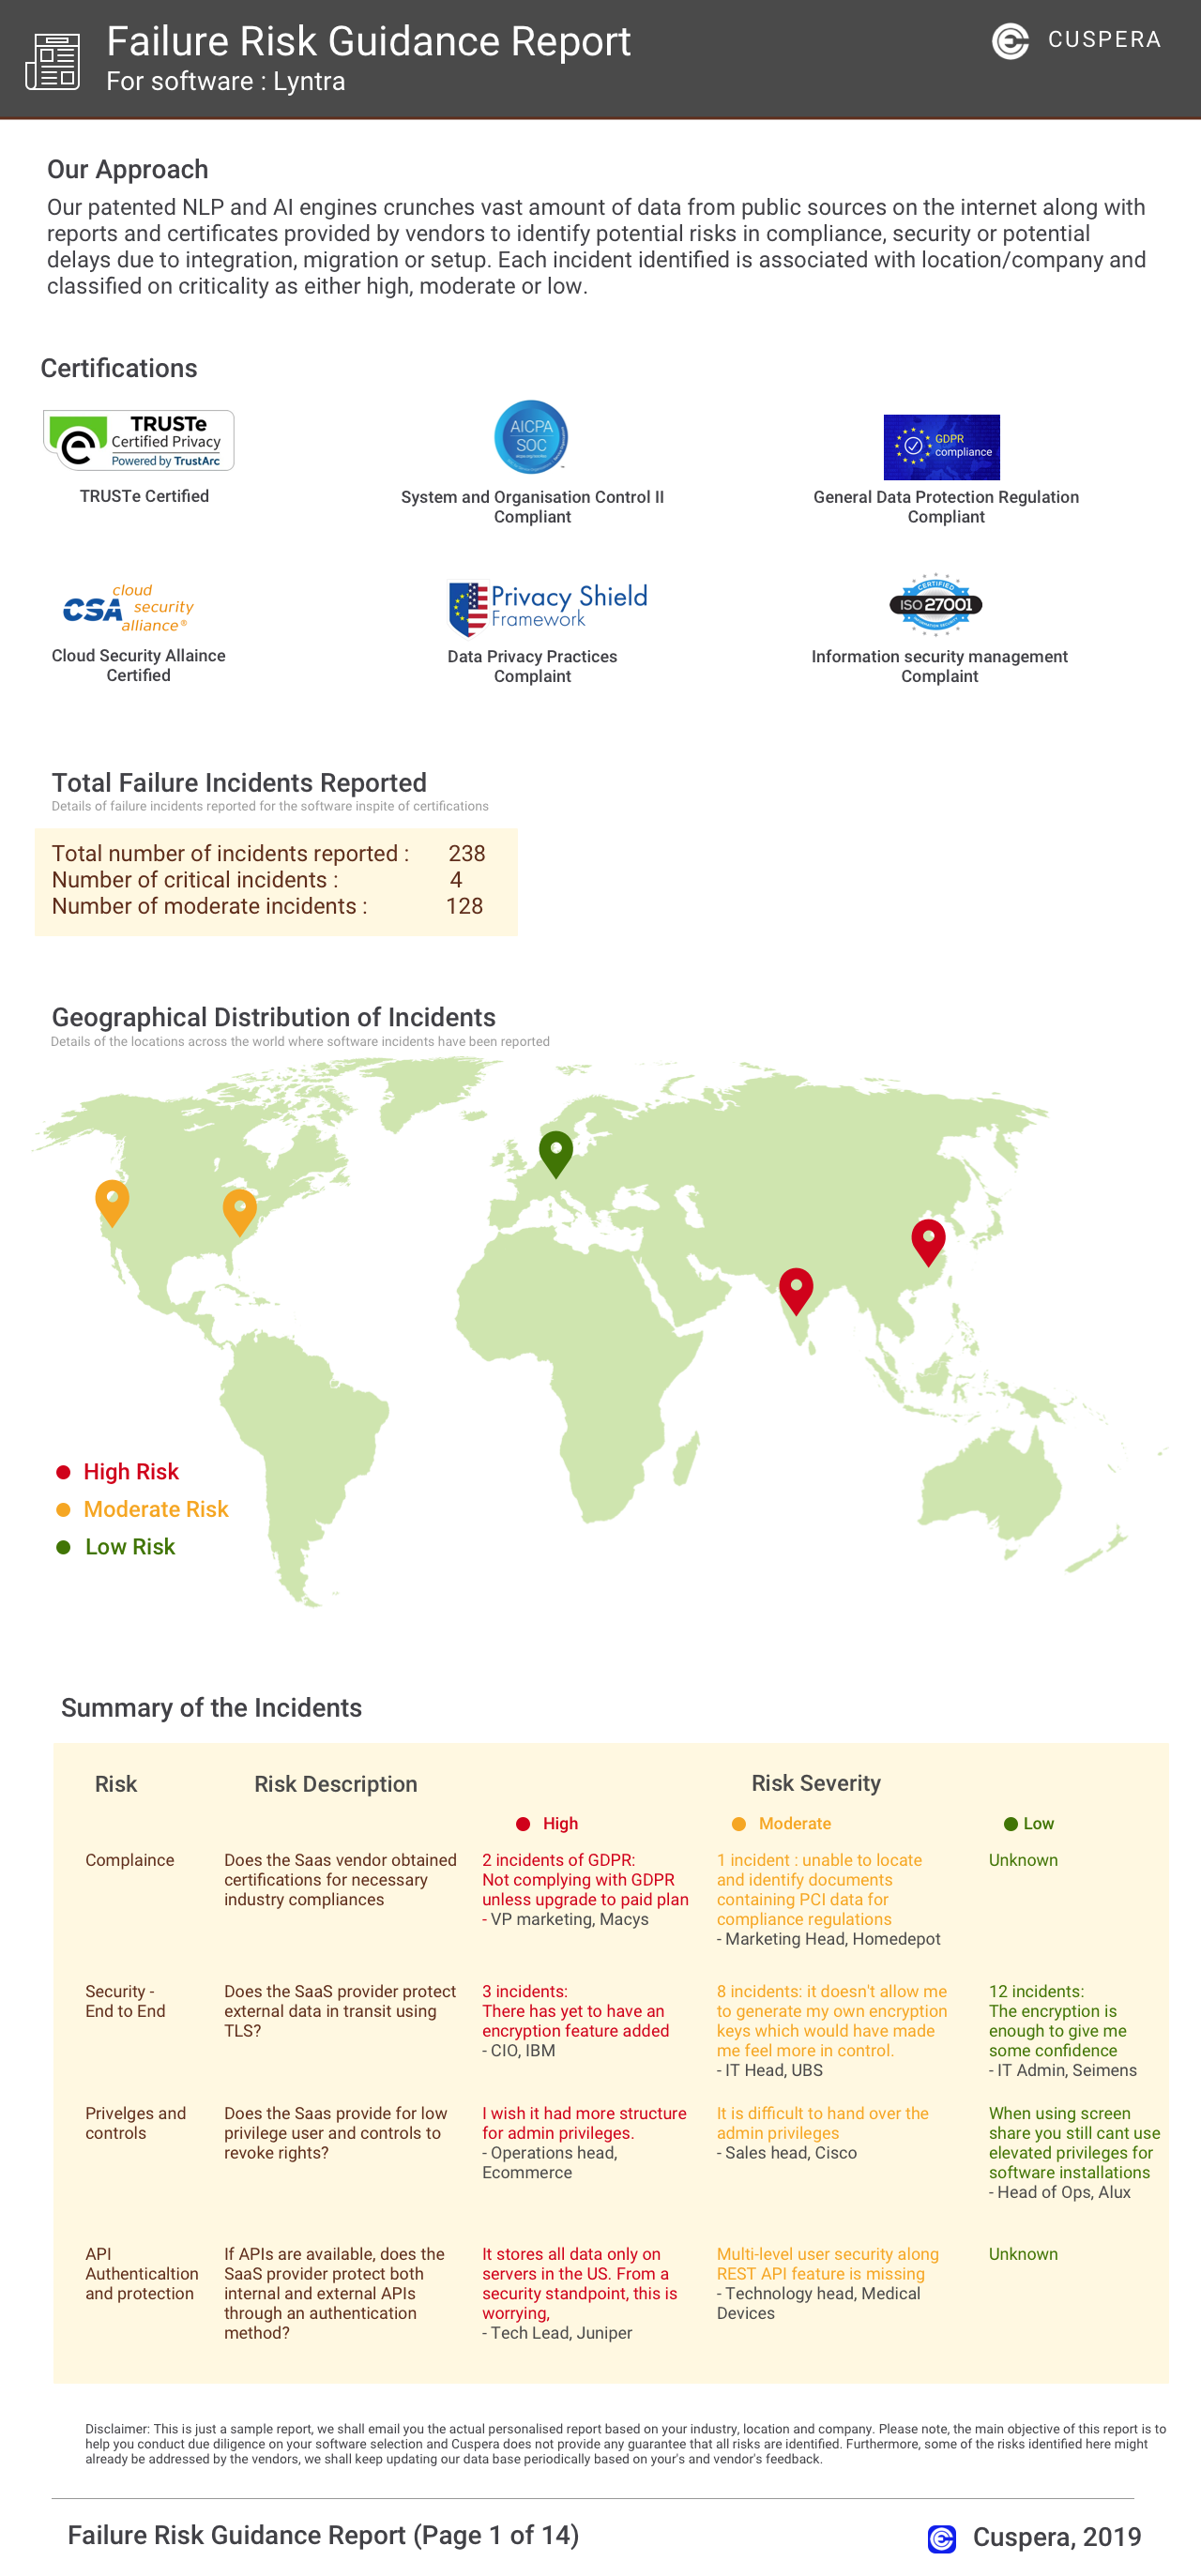
Software Failure Risk Guidance
?for DBxtra
Overall Risk Meter
Top Failure Risks for DBxtra
DBxtra Profile
Company Name
DBxtra
Company Website
https://dbxtra.com/HQ Location
Bernardo Quintana Sur 302 - 2nd Floor - Office 233, Punto Sur, Col. Centro Sur, Queretaro, Qro. 76030, MX
Social


What makes DBxtra ideal for Social Media Analytics?