

flex.bi Overview
flex.bi addresses the challenge of transforming raw data into actionable insights. It provides a flexible business intelligence platform that connects various data sources, enabling businesses to monitor performance metrics effectively. The platform acts as a reliable control center, allowing faster decision-making and fostering team efficiency. With flex.bi, users can experiment with their data through customized reports, enhancing their ability to interpret complex datasets. This solution is particularly beneficial for organizations seeking to streamline their data analysis processes and improve strategic planning. The platform's adaptability ensures it meets diverse business needs, facilitating a comprehensive understanding of operational dynamics.
Use Cases
Customers recommend Proposal & Quote Management, Workflow Management, Helpdesk Management, as the business use cases that they have been most satisfied with while using flex.bi.
Business Priorities
Enhance Customer Relationships and Improve ROI are the most popular business priorities that customers and associates have achieved using flex.bi.
flex.bi Use-Cases and Business Priorities: Customer Satisfaction Data
flex.bi works with different mediums / channels such as Phone Calls.
flex.bi's features include Dashboard, Recording, Personalization, etc. and flex.bi support capabilities include Chat Support, Phone Support, 24/7 Support, etc. also flex.bi analytics capabilities include Analytics, and Custom Reports.
Reviews
"flex.bi saves me hours of time of manually combining data and creates up to date reports and dashboards necessary for me and my team. The support team is easy to access and always willing to work together ." - Allan H
Peer review evidence (same sources as the product rating summary)
"...Favorite feature is the ease of building quotes and having sub categories to build an event out...." Peer review by tyler steel
"...We have spent a lot of time customising it, creating specific reports, documents, workflows, inventory suggestions, etc..." Peer review by Kealan C., Producer, Events Services
"...Their customer support is also helpful...." Peer review by Mike G.
flex.bi, Hyland, YetiForce CRM, Anylogic Simulation Software, Knowi Platform, etc., all belong to a category of solutions that help Business Intelligence. Each of them excels in different abilities. Therefore, determining the best platform for your business will depend on your specific needs and requirements.
Flex.bi gathers company data in one place, saving time and aiding faster decision-making. It offers visualization tools, report sharing, and automated dashboard delivery to enhance team effectiveness.
Popular Business Setting
for flex.bi
Top Industries
- Events Services
- Entertainment
- Information Technology and Services
Popular in
- Small Business
- Mid Market
- Enterprise
flex.bi is popular in Events Services, Entertainment, and Information Technology And Services and is widely used by Small Business, Mid Market, and Enterprise.
flex.bi Customer wins, Customer success stories, Case studies
How efficiently Does flex.bi manage your Proposal & Quote Management?
How efficiently Does flex.bi manage your Workflow Management?
What makes flex.bi ideal for Helpdesk Management?
What benefits does flex.bi offer for Contact List Management?
How does flex.bi address your Motivation Management Challenges?
| CUSTOMERS | TESTIMONIALS |
|---|---|

|
flex.bi saves me hours of time of manually combining data and creates up to date reports and dashboards necessary for me and my team. The support team is easy to access and always willing to work together . Testimonial By Allan H |
|
|
After implementing flex.bi, I don’t have to ask my accountant as many questions as before, because I can answer them myself. All I have to do is log into flex.bi and open the necessary automated report. Testimonial By Valdis N |
|
|
We want to share relevant data with employees, and certainly flex.bi is a powerful business intelligence tool for displaying data in a structured and easily accessible way. Testimonial By Vilnis K |
| CUSTOMERS | TESTIMONIALS |
|---|---|
|
Allan H FD Digicape |
flex.bi saves me hours of time of manually combining data and creates up to date reports and dashboards necessary for me and my team. The support team is easy to access and always willing to work together . Testimonial By Allan H |
|
Valdis N Board-Member Latvia Timber International |
After implementing flex.bi, I don’t have to ask my accountant as many questions as before, because I can answer them myself. All I have to do is log into flex.bi and open the necessary automated report. Testimonial By Valdis N |
|
Vilnis K Board Member Baltu Veterinārija |
We want to share relevant data with employees, and certainly flex.bi is a powerful business intelligence tool for displaying data in a structured and easily accessible way. Testimonial By Vilnis K |
Kenfield Ltd - Manufacturing - Medium
VAS “Latvijas Autoceļu Uzturētājs” - Transportation/trucking/railroad
Retan Convenience Latvia (Narvesen) - Retail
Bsafety - Consumer Services
Kenfield Ltd - Manufacturing
flex.bi - Business (BI) & Data analytics platform introduction
Frequently Asked Questions (FAQ)
What buyers ask before choosing flex.bi
Integrations What CRM integrations are available for flex.bi?
flex.bi offers several CRM integrations to enhance its business intelligence capabilities, allowing users to leverage data from various sources for better reporting and analytics. Notably, it integrates seamlessly with Jira, enabling users to build custom reports and track results effectively. Additionally, flex.bi supports data connections from other REST API sources, which can include popular CRM platforms. While specific CRM integrations beyond Jira are not detailed in the provided context, users can expect flexibility in connecting with various data sources to create comprehensive dashboards. This integration capability is crucial for businesses looking to unify their data and gain actionable insights, ultimately driving better decision-making and improved performance.
Integrations How does flex.bi connect to Salesforce and what are the setup steps?
flex.bi connects to Salesforce by utilizing standardized connectors that facilitate seamless data integration. To set up this connection, first, ensure you have access to your Salesforce account and the necessary permissions to retrieve data. Next, log into your flex.bi dashboard and navigate to the data connection settings. Select Salesforce from the list of available data sources and enter your Salesforce credentials when prompted. Once authenticated, you can choose the specific data objects you wish to import into flex.bi. After selecting the desired data, configure any necessary filters or parameters to tailor the data import to your needs. Finally, save your settings, and you can start building reports and dashboards using the imported Salesforce data, enhancing your business intelligence capabilities.
Integrations Can I integrate flex.bi with HubSpot and what is the sync behavior?
Yes, you can integrate flex.bi with HubSpot, allowing you to leverage your HubSpot data for enhanced business intelligence insights. The integration facilitates the synchronization of data between HubSpot and flex.bi, enabling you to create comprehensive dashboards that visualize marketing, sales, and customer service metrics in real-time. The sync behavior typically involves automatic updates, ensuring that any changes made in HubSpot are reflected in your flex.bi dashboards without manual intervention. This seamless integration empowers teams to monitor performance, track leads, and analyze customer interactions more effectively, ultimately driving better decision-making and improving overall business outcomes. By utilizing flex.bi's capabilities alongside HubSpot, you can transform raw data into actionable insights that align with your company's goals.
Integrations What data-provider integrations does flex.bi support?
flex.bi supports a variety of data-provider integrations that enhance its business intelligence capabilities. Users can connect to standard data sources such as JIRA, SQL databases, and REST API data sources, allowing for seamless data retrieval and analysis. Additionally, flex.bi has recently integrated with Visma Horizon, expanding its compatibility with various business applications. This flexibility enables organizations to unify their data from multiple platforms, facilitating real-time insights and comprehensive reporting. By leveraging these integrations, businesses can create dynamic dashboards that reflect their operational metrics, ultimately driving better decision-making and performance improvements.
Integrations How do I configure flex.bi to work with Marketo?
To configure flex.bi to work with Marketo, you will need to follow a series of actionable steps. First, ensure you have access to both your flex.bi account and your Marketo instance. In flex.bi, navigate to the data integration section and select Marketo as your data source. You will then need to input your Marketo API credentials, which include your client ID and client secret, to establish a secure connection. Once connected, you can choose the specific data entities you want to import from Marketo, such as leads or campaigns. After selecting the desired data, configure the data mapping to ensure that the fields align correctly between Marketo and flex.bi. Finally, run a test import to verify that the data is being pulled correctly, and adjust any settings as necessary to optimize your reporting capabilities.
Integrations Are there any limitations on data flow between flex.bi and Dynamics 365?
Flex.bi offers robust integration capabilities with Dynamics 365, allowing for seamless data flow between the two platforms. However, users should be aware of potential limitations that may arise based on the specific configurations and data structures within their Dynamics 365 environment. For instance, the complexity of data models or the volume of data being transferred can impact performance and efficiency. Additionally, while flex.bi supports various data sources, including REST APIs, users may need to ensure that their Dynamics 365 instance is properly configured to facilitate smooth integration. To maximize the effectiveness of this integration, it is advisable to consult flex.bi's documentation or support services for guidance on best practices and any specific limitations that may apply to your unique setup.
Features What does the custom cube builder feature do in flex.bi?
The Custom Cube Builder feature in flex.bi allows users to create and customize their own data cube structures without needing to request custom development from the flex.bi team. This functionality is particularly beneficial for flex.bi Cloud Premium and Enterprise users, enabling them to add new properties to existing dimensions, create new measures from standard or custom registers, and even design entirely new dimensions. By leveraging this feature, businesses can tailor their reporting and data analysis to meet specific needs, integrating various business processes into a single report. This flexibility enhances the ability to derive actionable insights and make data-driven decisions, ultimately improving operational efficiency and strategic planning.
Features How do I create custom reports using flex.bi?
To create custom reports using flex.bi, start by accessing the platform and navigating to the report creation section. You can utilize the Templates Library to import a pre-existing report template in just 60 seconds, which serves as a foundation for your custom report. Next, use the "Select members" tab in each dimension to bookmark and filter data according to your needs. You can drag and drop dimensions into the "Pages" section to apply filters, and define custom groups of members using calculated members with functions like Aggregate or SUM. Once your report is built, it can be easily adjusted with a few clicks, allowing you to refine your insights and ensure the report meets your specific business requirements. For further guidance, consider watching the available tutorials on how to use dashboards and create reports effectively.
Features What types of visualizations can I create with flex.bi?
With flex.bi, you can create a wide variety of visualizations to effectively represent your data and derive actionable insights. The platform supports various types of charts and graphs, including bar charts, line graphs, pie charts, scatter plots, and heat maps, allowing you to choose the most suitable format for your data analysis needs. Additionally, flex.bi enables the creation of interactive dashboards that can display multiple visualizations simultaneously, facilitating a comprehensive view of your business metrics. You can also customize these visualizations easily through drag-and-drop functionality, ensuring that your reports are not only informative but also visually appealing. This flexibility in visualization types enhances your ability to communicate data-driven insights effectively to stakeholders.
Features How do I adjust published reports in flex.bi?
To adjust published reports in flex.bi, start by navigating to the report you wish to modify. You can easily make changes by using the drag-and-drop functionality to rearrange dimensions or add filters. To filter data, simply drag the desired dimension into the "Pages" section. If you need to create custom groups, utilize the "Calculated members" feature, where you can apply functions like Aggregate or SUM to define your groups. Additionally, you can select different time periods in the Time dimension to refine your analysis. Remember, even after reports are published, they remain flexible and can be adjusted with just a few clicks, allowing you to continuously adapt your insights to meet evolving business needs.
Features What is the process for drilling down into data dimensions in flex.bi?
Drilling down into data dimensions in flex.bi is a straightforward process designed to enhance your data analysis experience. To begin, access your report and identify the specific data dimension you wish to explore further. You can then utilize the drill-down feature, which allows you to click on a data point to reveal more granular details. This multi-dimensional analysis enables you to examine trends and actionable insights effectively. Additionally, flex.bi supports intuitive navigation, allowing you to drill across different dimensions seamlessly. If you need to adjust your view or focus on specific metrics, you can easily modify your report with just a few clicks and drag-and-drop actions. This flexibility ensures that your data exploration is both efficient and insightful, empowering you to make informed, data-driven decisions.
Features How do I set up and customize dashboards in flex.bi?
To set up and customize dashboards in flex.bi, start by accessing the platform and selecting the dashboard feature. You can import a report template from the Templates Library in just 60 seconds, which serves as a great foundation. Next, identify your goals and the specific metrics you want to display, ensuring the dashboard is user-friendly and functional. Utilize the drag-and-drop functionality to arrange widgets and data visualizations according to your preferences. You can connect various data sources, including JIRA, SQL, and REST APIs, to enrich your dashboard with real-time insights. Finally, embed your dashboard on TV screens or share it via email to keep your team aligned and motivated. For further guidance, consider watching the available tutorials on dashboard creation and customization.
ROI & pricing What measurable business outcomes can I expect from using flex.bi?
Using flex.bi can lead to several measurable business outcomes that significantly enhance operational efficiency and team performance. Companies have reported a reduction in manual reporting time, allowing employees to focus on strategic tasks instead of data entry, which can save hours each week. For instance, one client noted a 25% increase in call center productivity after implementing real-time dashboards that motivated teams and aligned them with company goals. Additionally, flex.bi facilitates better communication and decision-making by providing up-to-date insights, enabling teams to start meetings on the same page. Overall, businesses can expect improved agility, higher employee engagement, and ultimately, increased revenue as a result of streamlined processes and enhanced data visibility with flex.bi.
ROI & pricing How does flex.bi improve ROI for businesses in terms of cost savings and revenue impact?
flex.bi improves ROI for businesses by significantly enhancing operational efficiency and decision-making capabilities, leading to both cost savings and increased revenue. By automating reporting processes and integrating data from multiple sources, such as HansaWorld ERP and Google Analytics, companies can reduce the time spent on manual data handling, allowing management to focus on strategic initiatives. For instance, businesses like Kenfield Ltd have reported faster, data-driven decisions and improved team motivation through custom dashboards that track key performance indicators. Additionally, real-time insights enable companies to respond swiftly to market changes, optimize resource allocation, and align employee efforts with organizational goals, ultimately driving revenue growth. The combination of these factors results in a measurable impact on the bottom line, making flex.bi a valuable investment for businesses looking to enhance their financial performance.
ROI & pricing What are the different pricing plans available for flex.bi and what do they include?
flex.bi offers a variety of pricing plans tailored to meet different business needs, available in both Cloud and Enterprise versions. The Cloud plans include the Standard at €99/month, Business at €169/month, and Premium at €249/month, each providing varying levels of features and support. The Enterprise Server plan starts at €429/month and is designed for larger organizations, offering unlimited data cubes and customization options. Additionally, there are hosting and maintenance packages available for the Enterprise version, with options ranging from €150 to €250 depending on the package size. Each plan allows for extra users at an additional cost, ensuring flexibility as your team grows. You can also apply for a 30-day trial to explore the features before committing to a plan.
ROI & pricing What is the total cost of ownership for implementing flex.bi in my organization?
The total cost of ownership (TCO) for implementing flex.bi in your organization includes several components such as licensing fees, hosting options, and potential additional user costs. flex.bi offers various pricing plans, including Cloud Standard at €99/month, Cloud Business at €169/month, Cloud Premium at €249/month, and the Enterprise Server version starting at €429/month. Additional costs may arise from extra users, with each additional user priced at €15/month. It's also important to consider any customization or integration needs, which may incur further expenses. To get a precise estimate tailored to your organization's requirements, you can use the flex.bi pricing calculator or request a quote directly from their website. This comprehensive approach will help you understand the full financial commitment involved in adopting flex.bi for your business intelligence needs.
ROI & pricing How quickly can I see value from flex.bi after implementation?
After implementing flex.bi, users can typically start seeing value almost immediately, often within a few days. The platform is designed to automate reporting processes, significantly reducing the time spent on manual data analysis. For instance, users have reported that tasks that previously took hours or even days can now be completed in just minutes, allowing for quicker access to updated company information. Additionally, flex.bi facilitates agile communication with management, enabling teams to begin meetings with a clear understanding of current metrics and results. This immediate access to strategic and operational dashboards enhances decision-making and motivates employees by keeping them informed about company performance, ultimately driving efficiency and productivity from the outset.
ROI & pricing What are the implementation costs associated with adopting flex.bi?
The implementation costs associated with adopting flex.bi can vary based on the chosen version and specific requirements of your organization. flex.bi offers several pricing plans, including Cloud Standard, Cloud Business, Cloud Premium, and Enterprise options, each tailored to different business needs. Additionally, costs may include hosting and maintenance packages, which are particularly relevant for the Enterprise license. It's important to consider potential extra user fees if your team exceeds the standard user limits. To get a precise estimate, you can request a quote directly from flex.bi, which will take into account your unique specifications and desired features. Furthermore, flex.bi provides a 30-day trial, allowing you to evaluate the software before committing to any financial investment.
Capabilities Can flex.bi create custom reports?
Yes, flex.bi can create custom reports tailored to your specific business needs. The platform allows users to build and adjust reports easily through a user-friendly interface that supports drag-and-drop functionality. You can start by importing report templates from the Templates Library in just 60 seconds, and then customize them to fit your requirements. Additionally, flex.bi enables multi-dimensional analysis, allowing you to drill down into data and uncover actionable insights. This flexibility not only enhances your reporting capabilities but also helps in making data-driven decisions efficiently. Whether you need to analyze sales, financial data, or project results, flex.bi provides the tools necessary to create comprehensive and localized reports that meet your organization's objectives.
Capabilities Does flex.bi support real-time analytics?
Yes, flex.bi supports real-time analytics, allowing businesses to monitor their data as it changes. With flex.bi, users can create dynamic dashboards that provide instant feedback on various metrics, such as issue resolution times and project budgets, directly from data sources like Jira, SQL, and other REST APIs. This capability enables teams to make data-driven decisions quickly, enhancing productivity and alignment with company goals. Additionally, flex.bi's integration with multiple data sources means that users can visualize and analyze data in real-time, fostering a more responsive and motivated work environment. By leveraging real-time analytics, organizations can identify trends, opportunities, and actionable insights, ultimately driving better business outcomes.
Capabilities Can flex.bi provide interactive dashboards for data visualization?
Yes, flex.bi can provide interactive dashboards for data visualization, enabling users to explore and analyze their data effectively. With its multi-dimensional analysis capabilities, flex.bi allows users to drill down into reports and uncover actionable insights, trends, and opportunities. The platform supports various data sources, including Jira, SQL, and REST APIs, making it versatile for different business needs. Users can create custom reports and dashboards that are not only visually appealing but also functional, ensuring that teams can monitor performance and motivate collaboration. Additionally, flex.bi offers features like real-time updates and easy adjustments to reports, enhancing the overall user experience and facilitating data-driven decision-making.
Capabilities Does flex.bi offer user management features?
Yes, flex.bi offers user management features that allow businesses to effectively manage their user base within the platform. Users can be categorized based on different licensing options, such as flex.bi Cloud Standard, Business, Premium, and Enterprise, which cater to varying needs and scales of operation. The platform also provides options for adding extra users, enabling organizations to scale their user access as needed. This flexibility is crucial for businesses looking to maintain control over who can access sensitive data and reports, ensuring that only authorized personnel can view or manipulate information. Additionally, the user management capabilities support collaboration among team members, enhancing productivity and data-driven decision-making across the organization.
Capabilities Can flex.bi handle financial reporting and operational metrics?
Yes, flex.bi is well-equipped to handle financial reporting and operational metrics effectively. The platform allows users to create custom dashboards that integrate data from various sources, including financial systems and operational tools, enabling comprehensive analysis of key performance indicators. For instance, companies like Kenfield Ltd have successfully utilized flex.bi to automate their reporting processes, combining sales, financial, and operational data into one cohesive view. This integration not only streamlines reporting but also facilitates data-driven decision-making, allowing businesses to track progress against budgets and operational goals. With features like multi-dimensional analysis and customizable report templates, flex.bi empowers organizations to gain actionable insights into their financial and operational performance, ultimately enhancing strategic planning and execution.
Capabilities Does flex.bi comply with SOC 2 security standards?
Yes, flex.bi complies with SOC 2 security standards, which are designed to ensure that service providers manage customer data securely to protect the interests and privacy of their clients. This compliance reflects flex.bi's commitment to delivering secure and reliable software products and cloud services that customers can trust. The company implements rigorous policies and procedures that align with SOC 2 requirements, focusing on security, availability, processing integrity, confidentiality, and privacy. By adhering to these standards, flex.bi not only enhances its security posture but also provides customers with confidence in the protection of their sensitive data while using flex.bi Cloud services.
Use cases How can SDRs use flex.bi to improve their lead tracking and follow-up processes?
Sales Development Representatives (SDRs) can leverage flex.bi to enhance their lead tracking and follow-up processes by utilizing its powerful dashboard capabilities and data integration features. By connecting data sources such as CRM systems and marketing platforms, SDRs can create customized dashboards that provide real-time insights into lead activity, engagement levels, and follow-up effectiveness. This allows SDRs to prioritize leads based on their interactions and behaviors, ensuring timely and relevant follow-ups. Additionally, flex.bi's automated reporting features reduce the time spent on manual data compilation, enabling SDRs to focus more on strategic outreach. With the ability to visualize key metrics and track performance over time, SDRs can refine their strategies, improve conversion rates, and ultimately drive more successful lead engagements.
Use cases What are the best use cases for flex.bi in marketing teams looking to analyze campaign performance?
Flex.bi offers several valuable use cases for marketing teams aiming to analyze campaign performance effectively. One of the primary applications is the creation of strategic and operational dashboards that visualize key metrics such as conversion rates, customer engagement, and return on investment (ROI) for various campaigns. By integrating data from multiple sources, including Google Analytics and CRM systems, marketing teams can gain a comprehensive view of their campaign performance in real-time. Additionally, flex.bi enables teams to track and compare the effectiveness of different marketing channels, allowing for data-driven decisions on budget allocation and strategy adjustments. This capability not only enhances transparency but also motivates team members by showcasing results and progress, ultimately leading to more efficient campaign management and improved outcomes.
Use cases In what scenarios should RevOps teams implement flex.bi for better data visualization and reporting?
RevOps teams should implement flex.bi for better data visualization and reporting in scenarios where they need to consolidate data from multiple sources, such as Jira, ERP systems, and other REST API data sources, to gain actionable insights. For instance, when teams require real-time dashboards to monitor performance metrics, track project budgets, or analyze sales and service productivity, flex.bi can provide the necessary tools to create strategic and operational dashboards. Additionally, if the team aims to motivate employees by sharing results and aligning them with company goals, flex.bi's customizable reporting features can enhance engagement and decision-making. By leveraging flex.bi, RevOps teams can streamline their reporting processes, improve data accessibility, and ultimately drive better business outcomes.
Use cases How can sales leaders leverage flex.bi to create real-time dashboards for their teams?
Sales leaders can leverage flex.bi to create real-time dashboards by integrating data from various sources such as JIRA, SERP, and SQL, allowing for a comprehensive view of team performance and project progress. To get started, they can utilize flex.bi's user-friendly interface to connect their data sources and import report templates from the Templates Library in just 60 seconds. By customizing dashboards to display key performance indicators, sales leaders can motivate their teams through visual progress tracking and set clear goals. Additionally, embedding these dashboards on TV screens in the office or sharing them via email keeps the team aligned and informed. This real-time visibility not only enhances accountability but also empowers teams to make data-driven decisions, ultimately driving productivity and revenue growth.
Use cases What workflows can benefit from using flex.bi for customer data management in a call center environment?
Flex.bi can significantly enhance workflows in a call center environment by automating data integration and reporting, which streamlines customer data management. For instance, it allows call centers to consolidate data from various sources, such as CRM systems and telephony platforms, into real-time dashboards. This integration enables managers to monitor key performance indicators (KPIs) like call volume, response times, and customer satisfaction metrics all in one place. Additionally, flex.bi can facilitate the creation of competitions and performance tracking for sales and service teams, as demonstrated by Rolling, which boosted productivity by 25%. By providing actionable insights and reducing manual reporting efforts, flex.bi empowers call center teams to make informed decisions quickly, ultimately improving operational efficiency and customer service outcomes.
Use cases When is it most effective for a health and wellness team to adopt flex.bi for analytics and decision-making?
Adopting flex.bi for analytics and decision-making is most effective for a health and wellness team when they are ready to enhance their data-driven culture and streamline reporting processes. This typically occurs when the team faces challenges in managing large volumes of data from various sources, such as patient records, financials, and operational metrics. Implementing flex.bi can significantly improve efficiency by automating reporting and providing real-time dashboards that facilitate quick decision-making. Additionally, it is ideal during periods of growth or when launching new services, as it allows teams to track performance metrics, customer satisfaction, and operational efficiency effectively. By integrating flex.bi, health and wellness teams can foster a motivated workforce aligned with organizational goals, ultimately leading to improved patient care and business outcomes.
Alternatives What are the key differences between flex.bi and Domo?
The key differences between flex.bi and Domo primarily lie in their target audience, pricing structure, and feature sets. flex.bi is designed for businesses seeking a customizable and cost-effective business intelligence solution, offering flexible licensing options and a focus on user-friendly dashboard creation and data reporting. In contrast, Domo is a more comprehensive platform that integrates a wide range of data sources and provides advanced analytics capabilities, but it often comes with a higher price tag. While Domo excels in its extensive data visualization tools and collaboration features, flex.bi emphasizes ease of use and rapid deployment, making it suitable for companies looking for straightforward BI solutions without the complexity. Ultimately, the choice between the two will depend on your specific business needs and budget considerations.
Alternatives How does flex.bi compare to Sisense in terms of features and usability?
flex.bi and Sisense both offer robust business intelligence solutions, but they differ in features and usability. flex.bi emphasizes instant feedback and multi-dimensional analysis, allowing users to create and adjust custom reports easily with drag-and-drop functionality. It integrates seamlessly with various data sources, including Jira, SQL, and REST APIs, making it user-friendly for teams looking to visualize data quickly. In contrast, Sisense is known for its powerful data modeling capabilities and advanced analytics, which may appeal to organizations needing deeper insights from complex datasets. While Sisense can handle larger data volumes and offers extensive customization, flex.bi focuses on simplicity and speed, making it ideal for teams that prioritize quick access to actionable insights without extensive technical expertise. Ultimately, the choice between the two will depend on specific business needs and user preferences.
Alternatives What are the advantages of using flex.bi over MicroStrategy?
Flex.bi offers several advantages over MicroStrategy, particularly in terms of ease of use and flexibility. While MicroStrategy is a powerful business intelligence tool, it often requires advanced programming skills for effective utilization, which can be a barrier for many users. In contrast, flex.bi is designed to be user-friendly, allowing users to create custom reports and dashboards without extensive technical knowledge. Additionally, flex.bi provides instant feedback and multi-dimensional analysis, enabling users to drill down into data effortlessly. This flexibility allows businesses to adapt their reports quickly with simple drag-and-drop functionality. Furthermore, flex.bi's support team is readily accessible, ensuring users receive assistance when needed, which can enhance the overall user experience compared to MicroStrategy's more complex support structure.
Alternatives What are the best alternatives to flex.bi for business intelligence?
When considering alternatives to flex.bi for business intelligence, several notable options stand out. Alteryx is a strong contender, offering advanced data preparation and analytics capabilities, while Zoho Business Intelligence provides a user-friendly interface and robust reporting features suitable for small to medium-sized businesses. Preset BI is another alternative, focusing on data visualization and dashboarding, making it ideal for teams looking to create insightful reports quickly. Additionally, for those seeking free options, tools like Apache Superset and Metabase can serve as open-source alternatives, providing essential BI functionalities without the associated costs. Each of these alternatives has unique strengths, so the best choice will depend on your specific business needs and budget.
Alternatives How does flex.bi stack up against TIBCO Spotfire?
When comparing flex.bi and TIBCO Spotfire, both platforms offer robust business intelligence capabilities, but they cater to different user needs. flex.bi is designed for ease of use, allowing users to create dashboards and reports quickly without advanced programming skills, making it ideal for teams looking for a straightforward solution. It integrates seamlessly with various data sources, including Jira, and emphasizes real-time analytics and user-friendly dashboards. In contrast, TIBCO Spotfire is known for its advanced analytics features, including predictive analytics and data visualization, which may appeal to organizations requiring deeper analytical capabilities. Ultimately, the choice between flex.bi and TIBCO Spotfire depends on your team's specific needs for simplicity versus advanced analytical features.
Alternatives What makes flex.bi a better choice than other business intelligence platforms?
flex.bi stands out among business intelligence platforms due to its user-friendly interface and flexibility, allowing users to create real-time dashboards and reports without requiring advanced programming skills. Unlike many competitors, flex.bi offers standardized connectors for various data sources, including JIRA, SQL, and REST APIs, enabling seamless integration and quick setup. Additionally, its focus on actionable insights and multi-dimensional analysis empowers businesses to make data-driven decisions efficiently. Customers have reported significant time savings and increased profitability, highlighting the platform's effectiveness in streamlining reporting processes. With a supportive team and a commitment to helping organizations achieve their goals, flex.bi provides a comprehensive solution that caters to both beginners and experts, making it a compelling choice for businesses looking to enhance their data analytics capabilities.
flex.bi Competitors


flex.bi Features
- Low
- Medium
- High
| FEATURE | RATINGS AND REVIEWS |
|---|---|
| Analytics | Read Reviews (16) |
| Custom Reports | Read Reviews (165) |
| CAPABILITIES | RATINGS AND REVIEWS |
|---|---|
| Analytics | Read Reviews (16) |
| Custom Reports | Read Reviews (165) |
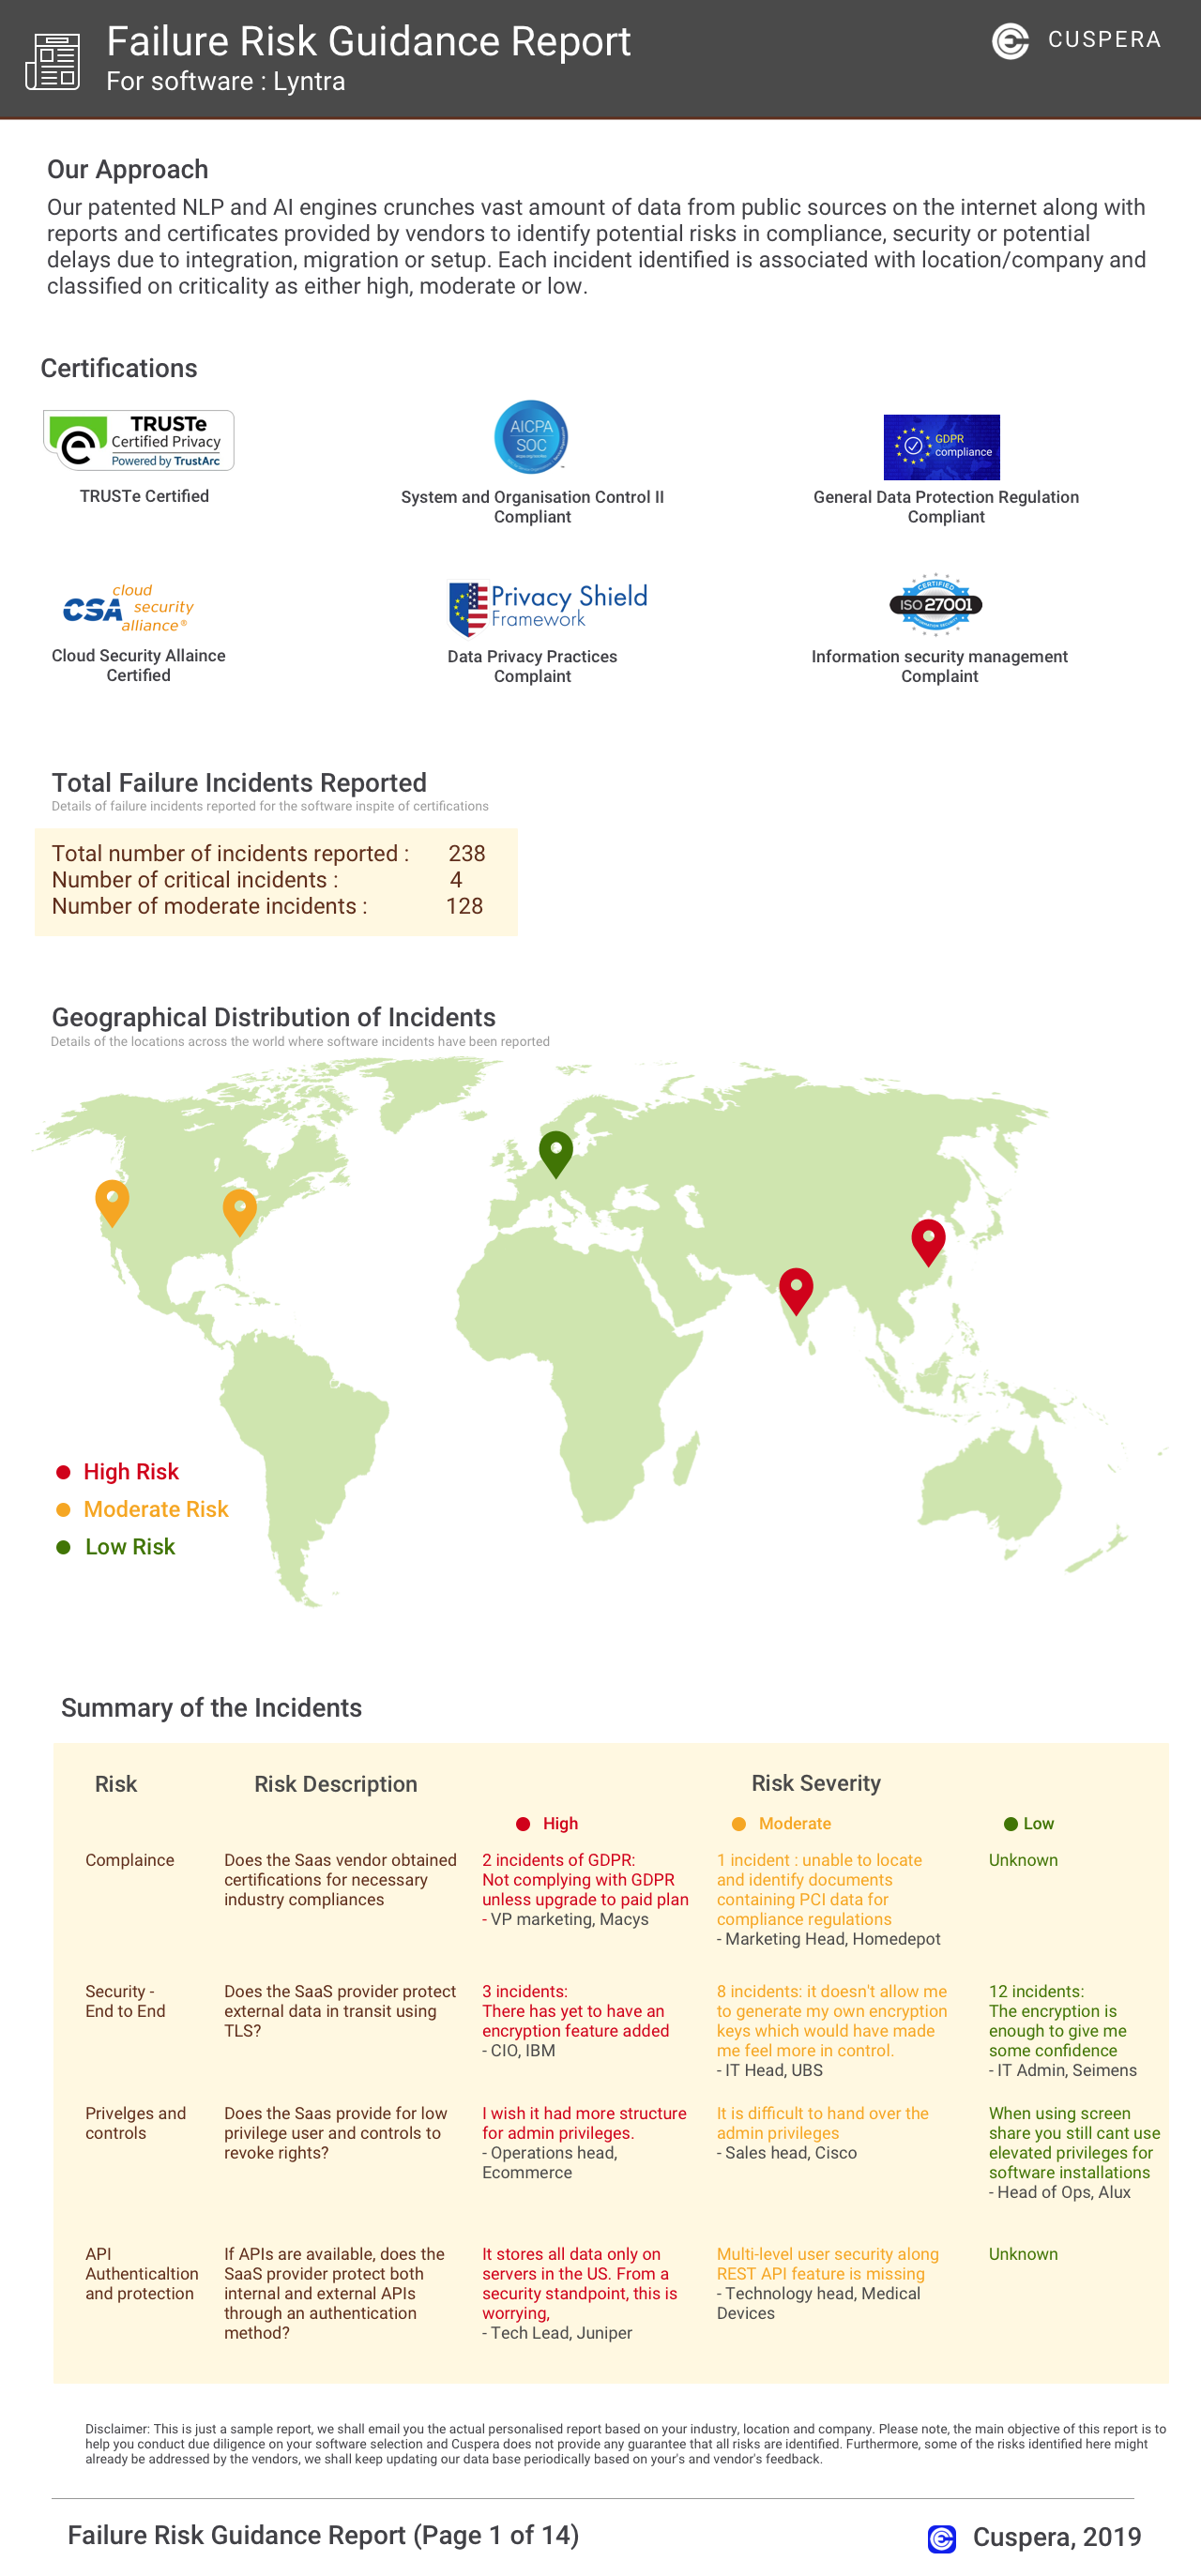
Software Failure Risk Guidance
?for flex.bi
Overall Risk Meter
Top Failure Risks for flex.bi
flex.bi News
Whisker and Flex Expand HSA/FSA Access for Eligible Everyday Pet Care ...
Flex and Whisker have partnered to integrate HSA/FSA payment options into Whisker's checkout process, allowing eligible customers to use pre-tax funds for Whisker products. This collaboration aims to enhance accessibility for individuals with health conditions by simplifying the purchase of pet care solutions.
Flex Plans Cloud and Power Unit Spin-Off
Flex announced plans to spin off its Power and Cloud portfolio into two independent, publicly traded companies, SpinCo and Flex. SpinCo will focus on digital infrastructure for AI data centers, while Flex will continue as a manufacturing partner in various sectors. This strategic move aims to enhance focus, transparency, and growth for both entities.
Flex to Acquire Electrical Power Products to Boost Power Capabilities
Flex Ltd. is set to acquire Electrical Power Products, Inc. for approximately $1.1 billion in an all-cash deal. This acquisition aims to enhance Flex's capabilities in engineered-to-order power distribution and control systems, expanding its presence in high-growth markets like grid modernization and electrification. The transaction is expected to close in the first quarter of Flex's fiscal 2027, subject to customary conditions.
Flex Announces Agreement to Acquire Electrical Power Products (EP2)
Flex has announced a definitive agreement to acquire Electrical Power Products (EP2) for approximately $1.1 billion. This acquisition will expand Flex's Critical Power portfolio by adding EP2's expertise in engineered-to-order electrical power control and protection systems. The transaction is expected to close in the first quarter of Flex's fiscal year 2027, pending regulatory approvals.
flex.bi Profile
Company Name
flex.bi
Company Website
https://flex.bi/HQ Location
Employees
2-10
Social


Financials
PRIVATE