Grafana Overview
Grafana offers an open-source analytics and monitoring solution tailored for diverse databases. It excels in visualization and contextualized root cause analysis, enabling businesses to gain deep insights into their data. Grafana's platform supports frontend, application, and infrastructure observability, which is crucial for maintaining system health. The inclusion of synthetic monitoring and performance testing tools allows for proactive issue identification. Grafana's capabilities extend to SLO management, alerting, and incident response, ensuring comprehensive monitoring and quick resolution of potential disruptions. Unique features like AI/ML insights and cost management provide additional layers of operational intelligence. The integration of tools such as Loki, Tempo, and Pyroscope within the Grafana Stack enhances its versatility, making it a powerful choice for businesses seeking a robust observability platform.
Use Cases
Customers recommend Collaboration, Funnel Analysis, Generation Of New Leads, as the business use cases that they have been most satisfied with while using Grafana.
Business Priorities
Scale Best Practices and Launch New Products are the most popular business priorities that customers and associates have achieved using Grafana.
Grafana Use-Cases and Business Priorities: Customer Satisfaction Data
Grafana works with different mediums / channels such as E-Mail.
Grafana's features include Dashboard, Alerts: Popups & Notifications, Widgets, etc. and Grafana support capabilities include 24/7 Support, Phone Support, Email Support, etc. also Grafana analytics capabilities include Custom Reports, and Analytics.
Reviews
"...Grafana is user friendly, we are using it for analysis & visualization of retail data over time...." Peer review by User
Peer review evidence (same sources as the product rating summary)
"...Collaborate...." Grafana: The open observability platform
"...Centralize the analysis, visualization, and alerting on all of your metrics. ..." Grafana: The open observability platform
"...Automatically generate PDFs from any dashboards and have it emailed to interested parties on a schedule White Labeling Replace the Grafana brand and logo with your own corporate brand and logo Export as dashboard Generate PDFs from any of your dashboards and save it to file Training and pro services...." Grafana Enterprise
Grafana, TWIPLA, Klipfolio, Buildfire, Unity Platform, etc., all belong to a category of solutions that help Digital Analytics. Each of them excels in different abilities. Therefore, determining the best platform for your business will depend on your specific needs and requirements.
Grafana is an open-source analytics and monitoring platform for various databases. It is developed by Grafana Labs for enhanced observability.
Popular Business Setting
for Grafana
Top Industries
- Information Technology and Services
- Internet
- Computer Software
Popular in
- Small Business
- Mid Market
- Enterprise
Grafana is popular in Information Technology And Services, Internet, and Computer Software and is widely used by Small Business, Mid Market, and Enterprise.
Grafana Customer wins, Customer success stories, Case studies
How can Grafana enhance your Collaboration process?
What Are the key features of Grafana for Generation Of New Leads?
11 buyers and buying teams have used Cuspera to assess how well Grafana solved their Digital Analytics needs. Cuspera uses 637 insights from these buyers along with peer reviews, customer case studies, testimonials, expert blogs and vendor provided installation data to help you assess the fit for your specific Digital Analytics needs.
How to Display Grafana Alerts to Your Dashboards

Frequently Asked Questions(FAQ)
for Grafana
What is Grafana?
Grafana is an open source visualization and analytics platform that unifies data sets across the company into an interactive diagnostic workspace. Grafana is built on a plug-in architecture that allows interaction with the underlying data sources without creating data copies.
Grafana allows querying, visualizing, alerting on and understanding the metrics no matter where they are stored. Create, explore, and share beautiful dashboards with the team and foster a data-driven culture. Its composable observability platform integrates metrics, traces, and logs with Grafana. Leverage the best open source observability software—including Prometheus, Loki, and Tempo—without the overhead of installing, maintaining, and scaling your observability stack.
Grafana’s key features include fast and flexible visualizations that allow visualizing the data as required, Connect the tools and the teams with Grafana plugins, create, manage, and silence all of the alerts within one simple UI, rename, summarize, combine, and perform calculations across different queries and data sources and more.
What is Grafana used for?
What are the top features of Grafana?
Who uses Grafana?
What are Grafana alternatives?
Where is Grafana located?

Peers used Grafana for collaboration and funnel analysis
Grafana Competitors


Grafana Features
- Low
- Medium
- High
| FEATURE | RATINGS AND REVIEWS |
|---|---|
| Custom Reports | Read Reviews (132) |
| Analytics | Read Reviews (24) |
| CAPABILITIES | RATINGS AND REVIEWS |
|---|---|
| Custom Reports | Read Reviews (132) |
| Analytics | Read Reviews (24) |
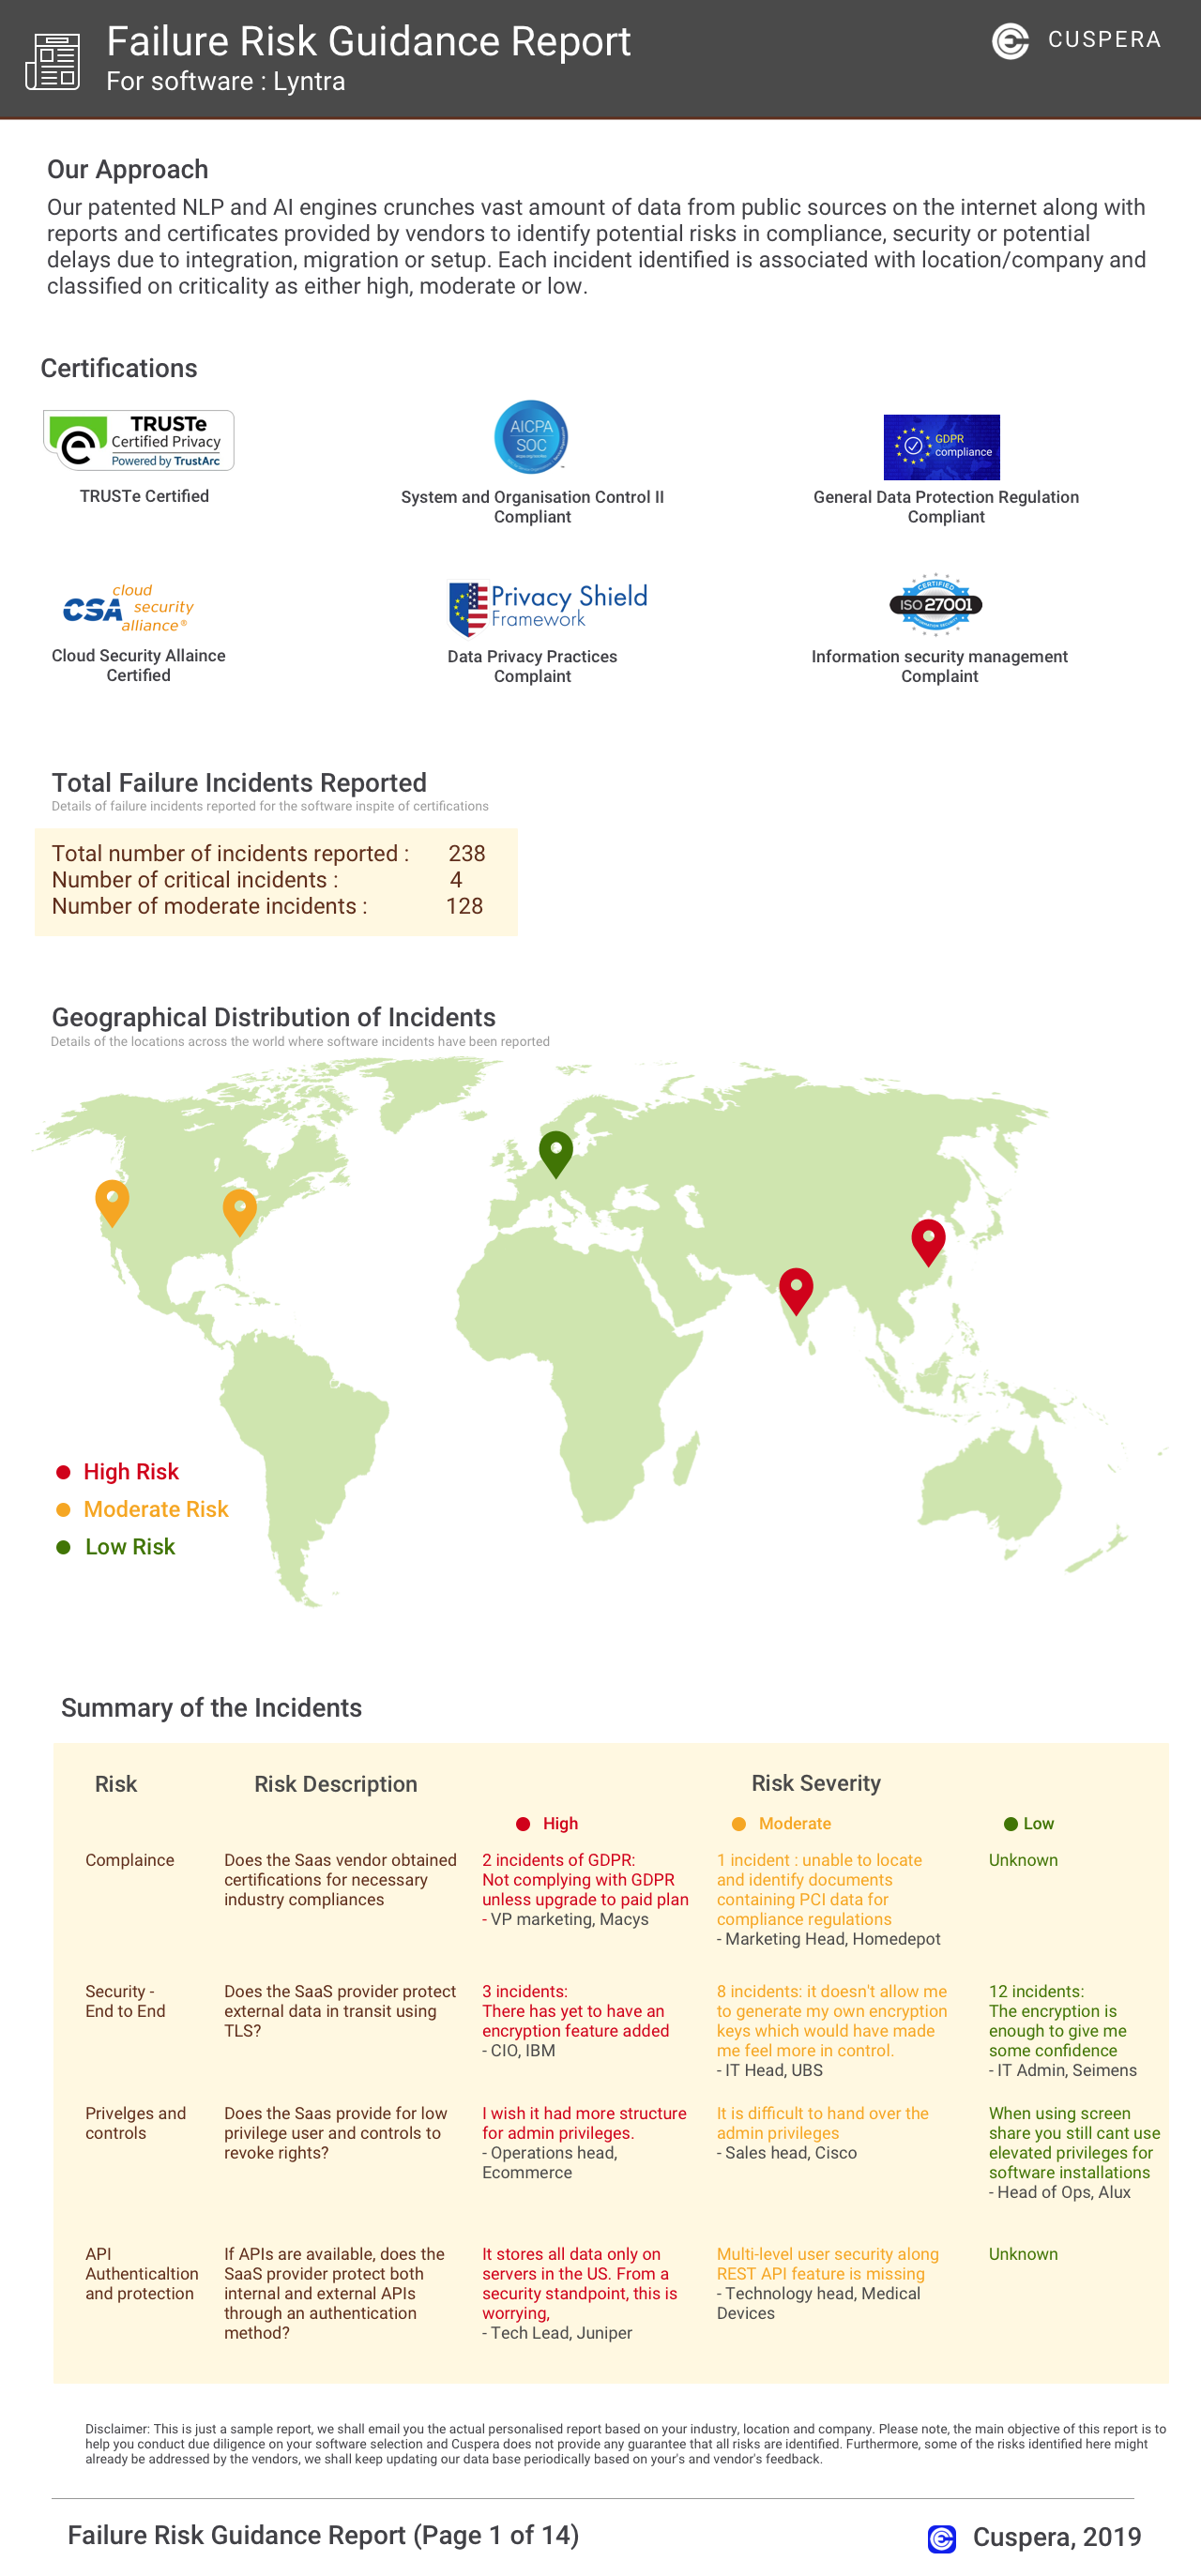
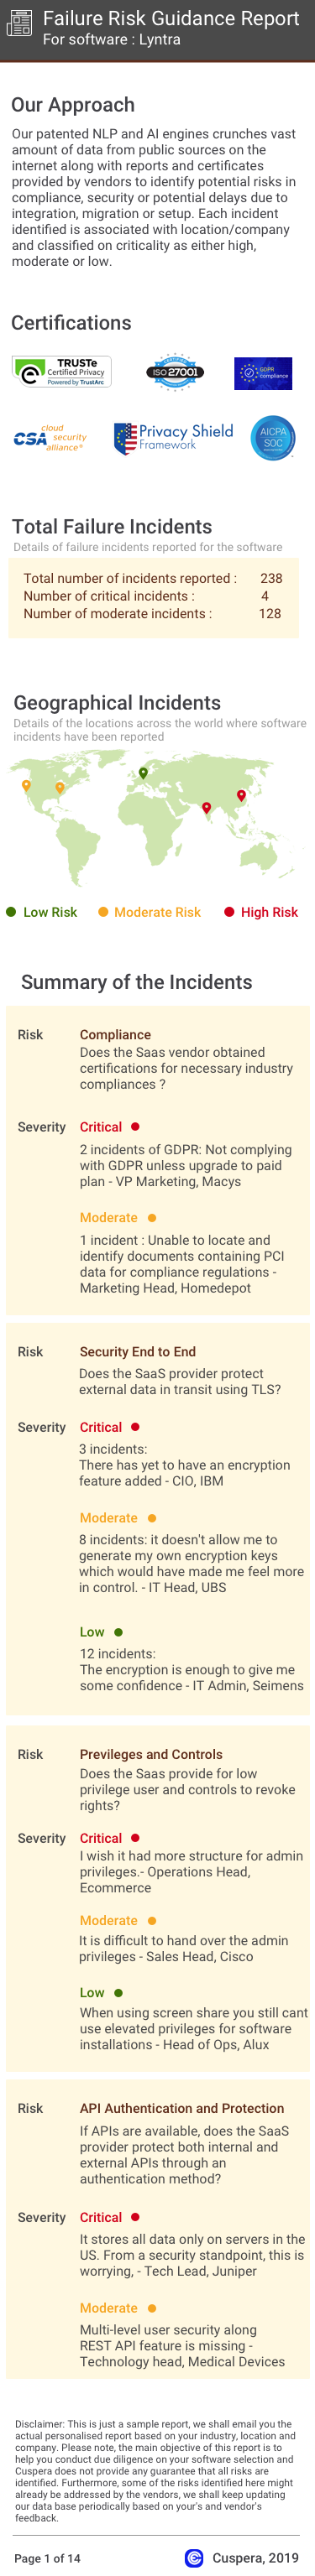
Software Failure Risk Guidance
?for Grafana
Overall Risk Meter
Top Failure Risks for Grafana
Grafana Labs News
Grafana Labs admits all its codebase are belong to someone who popped its GitHub account
Grafana Labs experienced a security breach where an attacker accessed its GitHub repository and stole its codebase. Despite the breach, no customer data was compromised, and operations remain unaffected. Grafana Labs has decided not to pay the ransom demanded by the attacker, citing FBI guidance and the open-source nature of many of its products. The company has taken steps to secure its environment.
Grafana's Kubernetes Monitoring Helm Chart v4 Brings Multiple Fixes
Grafana Labs has released version 4 of its Kubernetes Monitoring Helm chart, marking a significant update with multiple fixes. Key improvements include converting destinations from lists to maps for better configuration management, restructuring collectors, and separating service deployments from features. The update addresses memory usage issues and enhances flexibility for managing Kubernetes clusters. A migration tool is available for transitioning from version 3 to version 4.
OmniOps and Grafana bring sovereign observability to Saudi Arabia
OmniOps and Grafana Labs have partnered to launch a sovereign observability solution in Saudi Arabia. This collaboration supports Vision 2030 by enabling enterprises and public bodies to maintain data residency within the Kingdom, aligning with the push for digital sovereignty and local cloud capabilities.
GrafanaCON 2026: Grafana Labs Targets the "AI Blind Spot" with New ...
Grafana Labs introduced new AI-focused capabilities at GrafanaCON 2026, including AI Observability in Grafana Cloud, an expanded Grafana Assistant, Grafana Cloud CLI (GCX), and the open-source benchmark o11y-bench. These innovations aim to enhance real-time monitoring, AI-assisted workflows, and observability in AI systems, addressing the complexity of AI in production environments.
Grafana Labs Profile
Company Name
Grafana Labs
Company Website
//grafana.comHQ Location
New York, New York, United States
Employees
501-1000
Social
Financials
SERIES D