Comparison Summary
This comparison report of Canny vs. Spark Chart is based on a specific set of business needs and context. The comparison uses 1483 Cuspera insights based on peer reviews, case studies, testimonials, and expert opinions across 50+ sources.
Introducing Canny and Spark Chart
Canny, Spark Chart, Thematic, Medallia Agent Connect, etc., belong to a category of solutions that help Customer Feedback Management. Different products excel in different areas, so the best platform for your business will depend on your specific needs and requirements.
Canny covers Collecting Feedback, Engaging Conversational Surveys, Products & Pricelist Management, Review Customer Feedback, etc.
Spark Chart focuses on Collecting Feedback with Promotions, Social Media Management with Social Media, Training & Onboarding, Market Research with Promotions, etc.
"If you feel you're getting a lot of feedback and a big chunk of your time goes into discussing requests. If you have a hard time figuring out which features you should build next. If you want your product development to be community-driven. Canny is... an awesome tool. I'm sure you'll love it. " - Tim Soulo
"The software is super powerful, and the support is extremely responsive. The reporting capability in Spark Chart is absolutely incredible. The power and ability to customise the reports I have never seen in any other survey software. There is a lear...ning curve, but it’s to be expected. To do amazingly complex and clever surveys, you need to invest the time to learn how to drive it. " - Gabe A
Unsure which of these solutions is right for you? Our Cuspera AI engine can compare them based on your needs and specific to your industry and context. Get your personalized report today.


About
Canny: Customer Feedback Management Tool
Survey Software to uncover hidden knowledge & ideas
Financials
PRIVATE
Business Need
Total Processes
(we found evidences for)
37
29
Total Goals
(we found evidences for)
9
5
Top Processes
Evidences indicate better relative satisfaction
Top Goals
Goals Achieved
-
Scale best practices
-
Acquire customers
-
Launch new products
-
Enhance customer relationships
-
Improve internal communications
-
Improve visibility
-
Improve ROI
-
Improve brand engagement
-
Build brand awareness
- See 6 more
-
Enhance customer relationships
-
Acquire customers
-
Build brand awareness
-
Improve efficiency
-
Improve internal communications
- See 2 more
Top Channels
Channels Used
-
promotions
-
social media
-
e-mail
-
website
-
text SMS
-
phone calls
-
Facebook
- See 4 more
-
promotions
-
social media
-
e-mail
-
website
-
text SMS
-
phone calls
-
Facebook
- See 4 more
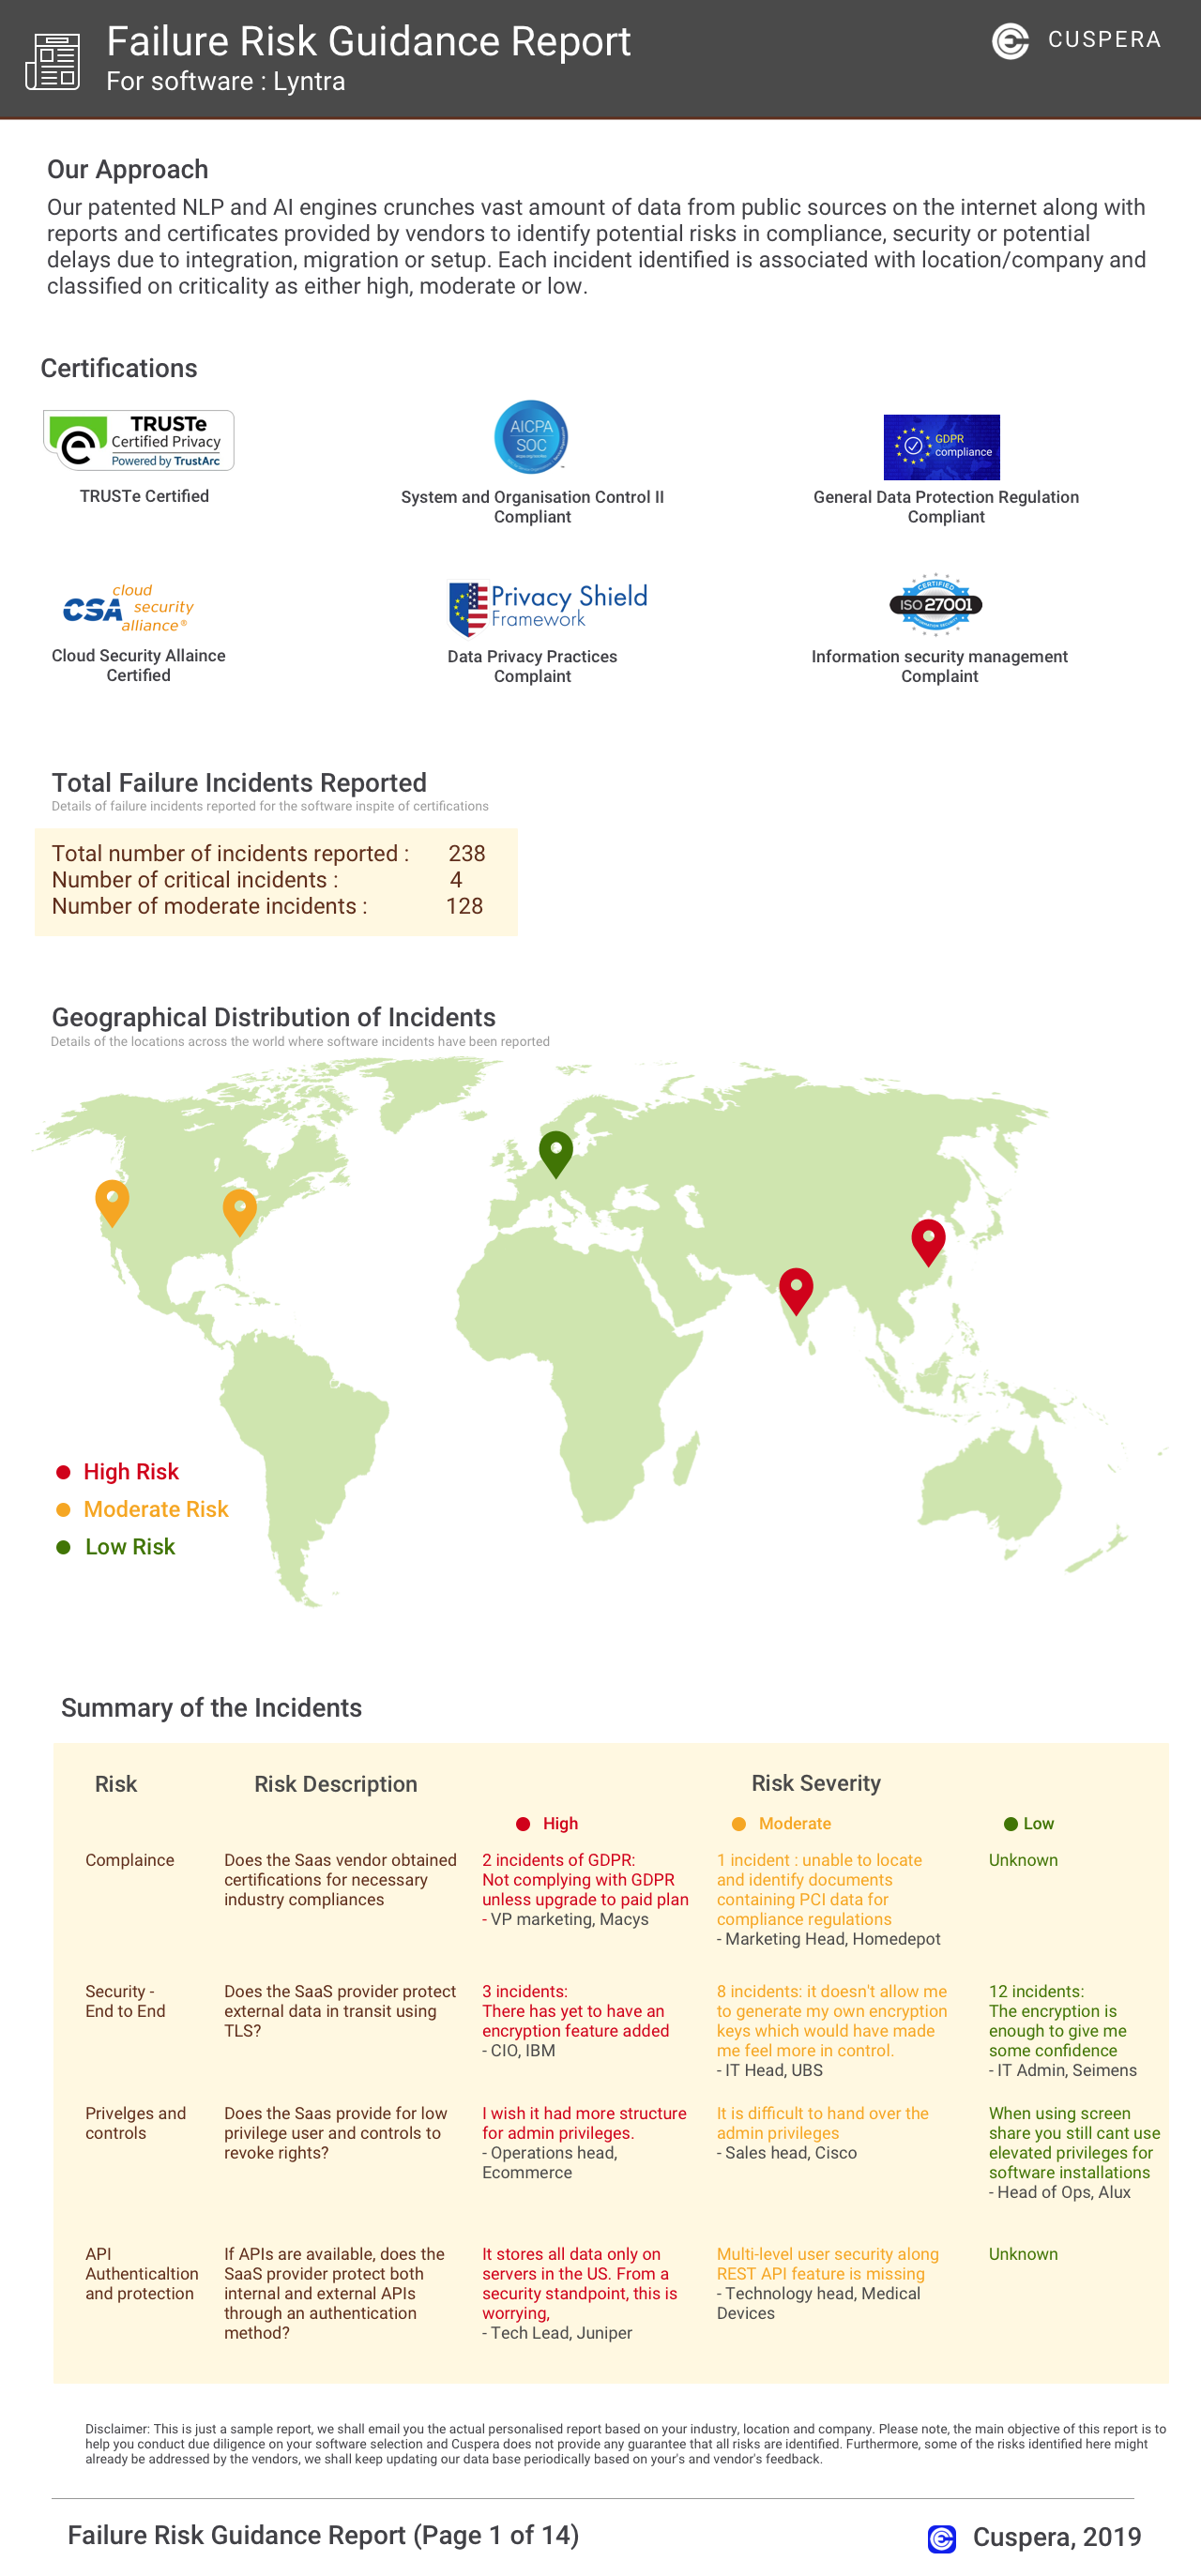
Failure Risk Guidance Security Report?
Compliance Risk
{{{rsh_C_1}}}
{{{rsh_C_1}}}
Security & Privacy Risk
{{{rsh_C_1}}}
{{{rsh_C_1}}}
Integration Risk
{{{rsh_C_1}}}
{{{rsh_C_1}}}
Migration Risk
{{{rsh_C_1}}}
{{{rsh_C_1}}}
IT and Other Capabilities
- Low
- Medium
- High