

Clear Analytics Overview
Clear Analytics addresses the challenge of democratizing business intelligence by transforming Excel into a powerful analytics tool. It integrates seamlessly with Microsoft Power BI, enabling users to leverage familiar Excel functionalities for advanced data analysis without additional training or migration hurdles. This solution facilitates accurate data sharing across departments, ensuring governance and compliance. By empowering users to become power analysts, Clear Analytics enhances collaboration and data-driven decision-making. A unique feature is its ability to maintain the ease of Excel while providing robust BI capabilities, making it an ideal choice for organizations seeking to enhance analytical capabilities without disrupting existing workflows.
Use Cases
Customers recommend Competitive Intelligence, Collaboration, Sending & Publishing Communications, as the business use cases that they have been most satisfied with while using Clear Analytics.
Business Priorities
Manage Risk and Improve ROI are the most popular business priorities that customers and associates have achieved using Clear Analytics.
Clear Analytics Use-Cases and Business Priorities: Customer Satisfaction Data
Clear Analytics works with different mediums / channels such as Mobile.
Clear Analytics's features include Dashboard. and Clear Analytics support capabilities include 24/7 Support, Email Support, Chat Support, etc. also Clear Analytics analytics capabilities include Analytics, and Custom Reports.
Reviews
"...Some key features include: Dynamic Data Refresh, Data Share and In-Excel Collaboration...." Peer review
Peer review evidence (same sources as the product rating summary)
"...A flexible Business Intelligence platform to meet growing regulatory needs Allow Risk Officers to self-query..." Case Study | Clear Analytics
"...Add custom queries, drag-and-drop, and collaborate right inside Excel. ..." Clear Analytics - Excel based Self Service analytics leveraging Power BI
"...Clear Analytics can also publish datasets directly to Power BI portal. ..." Clear Analytics - Excel based Self Service analytics leveraging Power BI
Clear Analytics, Phocas, ZAP Data Hub, Striim, Clicdata, etc., all belong to a category of solutions that help Business Intelligence. Each of them excels in different abilities. Therefore, determining the best platform for your business will depend on your specific needs and requirements.
Clear Analytics enables self-service analytics in Excel, leveraging Power BI for powerful business intelligence. Users can share and collaborate easily without training or migration.
Popular Business Setting
for Clear Analytics
Top Industries
- Food & Beverages
- Computer Software
- Education
Popular in
- Small Business
- Mid Market
Clear Analytics is popular in Food & Beverages, Computer Software, and Education and is widely used by Small Business, and Mid Market,
Clear Analytics Customer wins, Customer success stories, Case studies
What benefits does Clear Analytics offer for Competitive Intelligence?
What Are the key features of Clear Analytics for Collaboration?
How does Clear Analytics facilitate Sending & Publishing Communications?
How does Clear Analytics facilitate Proposal & Quote Management?
Frequently Asked Questions (FAQ)
What buyers ask before choosing Clear Analytics
Integrations What CRM integrations are available for Clear Analytics?
Clear Analytics offers seamless integration with several popular CRM platforms, enhancing its reporting capabilities and allowing users to leverage their customer data effectively. Notably, it integrates with Salesforce, enabling users to pull in customer relationship data directly into their Excel-based reports for real-time analysis. Additionally, Clear Analytics can work alongside HubSpot, providing users with insights into marketing and sales performance by incorporating data from their HubSpot CRM. These integrations facilitate a more comprehensive view of customer interactions and streamline the reporting process, empowering businesses to make data-driven decisions without the need for extensive IT support. By utilizing these CRM integrations, organizations can enhance their analytics capabilities and improve overall productivity.
Integrations How does Clear Analytics connect to Salesforce and HubSpot?
Clear Analytics connects to Salesforce and HubSpot by leveraging its robust data integration capabilities, allowing users to fetch and analyze data directly from these platforms within Excel. This integration enables businesses to create customized reports and dashboards that reflect real-time data from their CRM and marketing automation systems. Users can easily set up connections to Salesforce and HubSpot, pulling in relevant metrics and insights without the need for complex data warehousing or IT intervention. By utilizing Clear Analytics, organizations can streamline their reporting processes, enhance data visibility, and empower non-technical users to perform self-service analytics, ultimately driving better decision-making and improving overall productivity.
Integrations What are the setup steps for integrating Clear Analytics with Marketo?
To integrate Clear Analytics with Marketo, begin by ensuring you have administrative access to both platforms. First, log into your Clear Analytics account and navigate to the integration settings. Here, select Marketo from the list of available integrations. You will need to provide your Marketo API credentials, which include your Client ID and Client Secret, found in your Marketo admin panel under the API section. Once entered, configure the data synchronization settings to determine which data points you want to import from Marketo into Clear Analytics. After saving your settings, run a test sync to ensure the integration is functioning correctly. Finally, monitor the integration for any errors and adjust your settings as necessary to optimize data flow between Clear Analytics and Marketo.
Integrations Can Clear Analytics sync data with Snowflake and what is the sync behavior?
Clear Analytics can indeed sync data with Snowflake, allowing users to leverage the powerful cloud data platform for their reporting needs. The sync behavior involves Clear Analytics fetching data from Snowflake and caching it centrally, which ensures that reports are generated quickly and efficiently. This integration enables users to access fresh data directly within their Excel environment without the need for manual data imports or extensive IT involvement. By automating the data retrieval process, Clear Analytics enhances productivity and reduces the risks associated with manual data handling. This seamless connection empowers organizations to utilize their Snowflake data effectively, making it easier to create insightful reports and dashboards.
Integrations What are the limitations of data flow between Clear Analytics and Outreach?
Clear Analytics primarily focuses on providing self-service analytics through Excel and integrates with various data sources, but it does not specifically mention direct integration with Outreach, a sales engagement platform. This means that while you can leverage Clear Analytics to fetch and analyze data from multiple sources, the data flow between Clear Analytics and Outreach may require manual intervention or additional steps to ensure data synchronization. Users may need to export data from Outreach and import it into Clear Analytics for reporting purposes, which could limit real-time data access and increase the potential for errors. Therefore, organizations looking for seamless integration between these two platforms may need to consider custom solutions or third-party tools to facilitate a more efficient data flow.
Integrations Is there API access for Clear Analytics integrations, and how can it be configured?
Clear Analytics does not explicitly mention API access for integrations in the provided context. However, it does highlight its capability to integrate with Power BI, which suggests that there may be options for connecting with other tools and platforms through Power BI's API. To configure any potential integrations, users would typically need to follow the documentation provided by Power BI for setting up connections with Clear Analytics. This may involve establishing data sources, configuring authentication, and ensuring that the necessary permissions are in place for data access. For specific integration needs or to explore available options, it is advisable to consult with Clear Analytics' data specialists or refer to their support resources for detailed guidance.
Features What does the self-service analytics feature in Clear Analytics do?
The self-service analytics feature in Clear Analytics empowers users to independently access, analyze, and visualize data directly within Excel, eliminating the need for IT intervention. This functionality allows business users to leverage familiar Excel tools while benefiting from enhanced capabilities that streamline data consolidation and reporting. Users can create custom dashboards, run queries, and generate reports on-demand, significantly improving productivity by providing fresh data without the delays associated with traditional data requests. Additionally, Clear Analytics centralizes spreadsheet data, ensuring it is secure, version-controlled, and easily shareable across the organization. This feature not only democratizes data access but also fosters a culture of data-driven decision-making, enabling every user to become a "power analyst" within their business environment.
Features How do I create custom dashboards in Clear Analytics?
Creating custom dashboards in Clear Analytics is a straightforward process that leverages your existing Excel skills. Start by accessing the Clear Analytics application, where you can utilize the drag-and-drop interface to select the data sources you want to visualize. Use the built-in Excel functions to manipulate and analyze your data as needed. Once you have your data set, you can choose from various visualization options, such as charts and graphs, to represent your insights effectively. After designing your dashboard, save it on the Clear Analytics application server for secure storage and version control. This allows for easy collaboration and sharing with your team, ensuring everyone has access to the most up-to-date information. With Clear Analytics, you can create powerful, customized dashboards without the need for extensive training or IT support.
Features What is the process for importing data extracts into Clear Analytics spreadsheets?
The process for importing data extracts into Clear Analytics spreadsheets is designed to be seamless and efficient, eliminating the need for manual data handling. First, you establish a virtual link between your spreadsheet and the data source, allowing Clear Analytics to dynamically update your spreadsheets with the latest data at the click of a button. This integration ensures that any updates or corrections made to the data source are automatically reflected in your spreadsheets, maintaining accuracy and relevance. Additionally, Clear Analytics centralizes the storage of spreadsheet data, enabling easy access and governance over who can edit or view the data. This streamlined approach not only enhances productivity by reducing manual tasks but also mitigates the risks associated with orphaned data, ensuring that your organization always works with the most current information.
Features How does Clear Analytics ensure data security and governance?
Clear Analytics ensures data security and governance through a multi-faceted approach that prioritizes the protection of personal information and compliance with privacy standards. Data is stored on password-controlled servers with limited access, safeguarding it from unauthorized access or disclosure. The platform maintains a virtual link between spreadsheets and data sources, allowing for dynamic updates while preserving data integrity. Additionally, all reports and queries are centrally stored, versioned, and audited, which facilitates governance and stewardship. This centralized management not only enhances data quality but also mitigates risks associated with manual data handling. By implementing these robust security measures, Clear Analytics empowers users to manage their reporting needs confidently, while IT can focus on improving overall data governance practices.
Features What features does Clear Analytics offer for data cleansing?
Clear Analytics offers robust features for data cleansing that enhance the accuracy and reliability of your reports. By creating a virtual link between your spreadsheets and data sources, Clear Analytics ensures that the latest data is dynamically updated, eliminating orphaned data issues commonly found in traditional spreadsheets. This functionality allows users to track the origins of the data, including when it was extracted and by whom, which is crucial for maintaining data integrity. Additionally, the platform caches data from a wide variety of sources, enabling quick access to cleansed and summarized data while unburdening databases from repetitive queries. These features not only streamline the data cleansing process but also empower business users to manage their own reporting needs efficiently, ultimately improving data quality and stewardship practices within the organization.
Features How do I use the predictive modeling functionality in Clear Analytics?
To use the predictive modeling functionality in Clear Analytics, start by ensuring you have the application installed and integrated with your existing Excel environment. Begin by importing your dataset into Clear Analytics, where you can leverage its self-service capabilities to clean and prepare your data. Next, navigate to the predictive analytics features within the tool, which allow you to create models based on historical data trends. Utilize the drag-and-drop interface to select variables and define your predictive parameters. Once your model is set up, you can run analyses to generate forecasts and insights directly within Excel, enabling you to make data-driven decisions without needing extensive IT support. This functionality empowers users to harness advanced analytics while maintaining the familiarity of Excel.
ROI & pricing What measurable business value can Clear Analytics provide for my organization?
Clear Analytics provides measurable business value by significantly enhancing data accessibility and reporting efficiency within organizations. By leveraging an Excel-based self-service analytics platform, users can seamlessly integrate fresh data into their spreadsheets without the need for manual data preparation, which reduces errors and saves time. This capability allows teams to generate real-time insights, empowering them to make informed decisions quickly. Additionally, Clear Analytics eliminates the need for costly data warehouses and specialized report developers, leading to substantial cost savings. The centralized storage of reports ensures data security, version control, and auditability, further enhancing operational efficiency. Overall, Clear Analytics transforms data into actionable insights, driving productivity and fostering a data-driven culture within your organization.
ROI & pricing How can Clear Analytics improve ROI and lead to cost savings for my business?
Clear Analytics can significantly improve ROI and lead to cost savings for your business by streamlining the reporting process and reducing reliance on IT resources. As an Excel-based self-service analytics tool, it allows users to access and manipulate data directly within familiar spreadsheets, eliminating the need for costly data warehousing and specialized report developers. This not only accelerates the decision-making process by providing real-time data insights but also minimizes the risks associated with manual data preparation, such as errors and inefficiencies. Furthermore, by centralizing report storage on the Clear Analytics application server, businesses benefit from enhanced security, version control, and audit capabilities, ensuring that resources are used effectively and that data integrity is maintained. Overall, these features contribute to a more agile and cost-effective data management strategy, ultimately enhancing your bottom line.
ROI & pricing What are the different pricing plans available for Clear Analytics, and what do they include?
Clear Analytics offers several pricing plans tailored to different user needs. The Team Edition is priced at $89 per month for up to 8 users, while the Small Business plan costs $189 per month for a minimum of 3 months, accommodating more extensive user requirements. Both plans allow users to access the full suite of features, including self-service analytics and reporting capabilities, without restrictions on user types—meaning all users can be classified as Designers if desired. Additionally, Clear Analytics provides a 30-day free trial with no credit card required, allowing potential customers to explore the platform before committing to a subscription. This flexibility in pricing and user classification makes Clear Analytics an attractive option for businesses of varying sizes.
ROI & pricing What is the total cost of ownership for implementing Clear Analytics in my company?
The total cost of ownership (TCO) for implementing Clear Analytics in your company includes several factors. First, there are subscription costs, which vary based on the edition you choose; for example, the Small Business edition is priced at $189 per month, while the Team Edition is $89 per month. Additionally, consider any potential costs for server infrastructure; while Clear Analytics can be installed on an existing application server, a dedicated server may be recommended for handling large datasets, which could incur extra expenses. Training and support costs should also be factored in, as well as any customization needed for specific reporting requirements. Overall, Clear Analytics aims to provide a cost-effective solution by eliminating the need for data warehouses and specialist report developers, ultimately reducing long-term operational costs.
ROI & pricing How quickly can I expect to see value from Clear Analytics after implementation?
After implementing Clear Analytics, you can expect to see value within a month, as many users have reported being able to generate actionable insights quickly. The platform's integration with Excel allows users to leverage their existing skills, making it easier to create and manipulate reports without extensive training. Clear Analytics streamlines the data consolidation process, eliminating the need for manual data preparation and reducing the time spent on generating reports. This efficiency not only accelerates decision-making but also enhances productivity by providing fresh data on demand. By utilizing Clear Analytics, businesses can quickly transition to a data-driven approach, maximizing the return on investment shortly after deployment.
ROI & pricing What are the potential revenue impacts of using Clear Analytics for data analytics?
Using Clear Analytics for data analytics can significantly impact revenue by enhancing decision-making processes and operational efficiency. By providing real-time data integration directly within Excel, Clear Analytics eliminates the need for manual data preparation, reducing errors and saving time. This allows teams to focus on strategic initiatives rather than administrative tasks, leading to faster insights and more informed business decisions. Additionally, the ability to customize reports for various industries and functions means that organizations can tailor their analytics to meet specific market demands, potentially uncovering new revenue opportunities. Ultimately, the streamlined reporting and self-service capabilities empower users to act quickly on data insights, driving growth and improving overall financial performance.
Capabilities What capabilities does Clear Analytics offer for self-service data analytics?
Clear Analytics offers a robust suite of capabilities for self-service data analytics, primarily leveraging Excel and integrating with Power BI. This tool empowers users to create custom dashboards and queries without needing extensive IT support, allowing for quick access to accurate data on-demand. Users can utilize all native Excel functions while benefiting from additional features that enhance data consolidation and reporting. Clear Analytics also enables collaboration by allowing users to share and govern access to centrally stored spreadsheets, ensuring data security and version control. With its focus on business freedom, Clear Analytics significantly reduces the time spent waiting for IT, enabling every business user to become a power analyst and contribute to data-driven decision-making.
Capabilities Can Clear Analytics support multiple users editing spreadsheets simultaneously?
Yes, Clear Analytics can support multiple users editing spreadsheets simultaneously. Unlike traditional spreadsheet systems where users often face issues with file locking and version control, Clear Analytics allows for independent editing, appending, and maintaining of data by multiple users without the need to lock files. This functionality is particularly beneficial for organizations that rely on collaborative efforts, as it eliminates the risks associated with stale data and unverified logic. By centralizing the data storage and providing fine-grained entitlements, Clear Analytics ensures that all changes are tracked and managed effectively, allowing teams to work together seamlessly while maintaining data integrity and security.
Capabilities Does Clear Analytics provide version control and auditing for reports?
Yes, Clear Analytics provides robust version control and auditing for reports. All spreadsheets are stored centrally on the Clear Analytics application server, ensuring that your reports are safe, secure, and fully audited. This centralized storage allows users to easily revert to prior versions of reports if needed, which is crucial for maintaining data integrity and compliance. The application tracks the origins of the data, including when it was extracted and by whom, which enhances accountability and transparency. This feature not only helps in managing changes effectively but also reduces the risks associated with manual document preparation, ultimately empowering users to manage their reporting needs while allowing IT to focus on data quality and stewardship.
Capabilities Can Clear Analytics dynamically update data in spreadsheets with a single click?
Yes, Clear Analytics can dynamically update data in spreadsheets with a single click. This functionality is achieved through a virtual link between the spreadsheet and your data source, ensuring that the latest and most accurate data is always accessible. Unlike traditional methods that require manual importing or copying and pasting, Clear Analytics eliminates the risks associated with orphaned data by maintaining knowledge of the data's origins, extraction times, and user actions. This means that users can refresh their spreadsheets effortlessly, allowing for real-time insights and reducing the time spent on data preparation. By streamlining this process, Clear Analytics enhances productivity and ensures that decision-makers are working with the most current information available.
Capabilities Is Clear Analytics designed to ensure enterprise-level security and compliance?
Yes, Clear Analytics is designed to ensure enterprise-level security and compliance. The platform strictly protects the security of personal information and adheres to a comprehensive privacy policy that safeguards data from loss, misuse, unauthorized access, and alteration. Data is stored on password-controlled servers with limited access, ensuring that sensitive information is only available to authorized personnel. Additionally, Clear Analytics offers features such as version control and audit trails, allowing users to revert to prior versions of reports if necessary. This level of security and compliance is crucial for organizations that handle large volumes of data and require stringent measures to protect their information, making Clear Analytics a reliable choice for enterprises seeking robust data management solutions.
Capabilities Does Clear Analytics allow users to create custom dashboards and queries easily?
Yes, Clear Analytics allows users to create custom dashboards and queries easily, leveraging the familiar Excel environment. The platform features an intuitive query builder that enables non-technical business users to explore and analyze data without needing extensive training or IT support. Users can quickly add custom queries, utilize drag-and-drop functionality, and collaborate directly within Excel, making the process of generating reports and visualizations straightforward and efficient. This self-service capability empowers users to manage their own reporting needs, significantly enhancing productivity by eliminating the delays typically associated with traditional BI tools. Overall, Clear Analytics transforms Excel into a powerful business intelligence tool, enabling users to create tailored analytics solutions that meet their specific business requirements.
Use cases How can SDRs use Clear Analytics for predictive lead scoring?
Sales Development Representatives (SDRs) can leverage Clear Analytics for predictive lead scoring by utilizing its advanced predictive analytics capabilities to analyze historical data and identify patterns that indicate a lead's likelihood to convert. By integrating Clear Analytics with their existing CRM systems, SDRs can access real-time insights and score leads based on various criteria such as engagement levels, demographic information, and past interactions. This allows SDRs to prioritize their outreach efforts effectively, focusing on high-potential leads and optimizing their time management. Additionally, the self-service reporting feature enables SDRs to create customized dashboards that visualize lead scoring metrics, making it easier to track performance and adjust strategies accordingly. Overall, Clear Analytics empowers SDRs to make data-driven decisions, enhancing their lead qualification process and improving conversion rates.
Use cases What are the best use cases for Clear Analytics in demand generation for marketers?
Clear Analytics offers several compelling use cases for demand generation that can significantly enhance marketers' strategies. One of the primary applications is predictive lead scoring, which allows marketers to identify and prioritize leads based on their likelihood to convert, optimizing resource allocation. Additionally, Clear Analytics provides demand generation insights that help in understanding customer behavior and preferences, enabling targeted campaigns. The platform's industry-specific dashboards facilitate the visualization of key performance indicators, making it easier to track campaign effectiveness and adjust strategies in real-time. Furthermore, the self-service reporting feature empowers marketers to generate customized reports without relying on IT, streamlining the decision-making process. By leveraging these capabilities, marketers can enhance their demand generation efforts, ultimately driving higher conversion rates and improved ROI.
Use cases In what scenarios should RevOps teams implement Clear Analytics for customer segmentation?
RevOps teams should implement Clear Analytics for customer segmentation in scenarios where they need to efficiently analyze and categorize customer data to drive targeted marketing and sales strategies. Clear Analytics allows teams to fetch and cache data from various sources, enabling real-time insights without the need for complex data warehousing. This is particularly beneficial when dealing with large datasets, as it streamlines the reporting process and reduces manual data preparation, thus enhancing productivity. Additionally, the platform's ability to create industry-specific dashboards and customer segmentation reports empowers RevOps teams to identify key customer characteristics and behaviors, allowing for more personalized engagement and improved customer retention strategies. By leveraging Clear Analytics, RevOps can ensure that their segmentation efforts are data-driven and aligned with overall business objectives.
Use cases How can sales leaders leverage Clear Analytics for competitive analysis during sales strategy meetings?
Sales leaders can leverage Clear Analytics for competitive analysis during sales strategy meetings by utilizing its Excel-based self-service analytics capabilities to access and analyze real-time data efficiently. With Clear Analytics, sales teams can integrate various data sources, including market trends and competitor performance metrics, directly into their familiar Excel environment, allowing for quick comparisons and insights. This eliminates the need for manual data preparation, reducing errors and saving time. By visualizing data through customizable reports and dashboards, sales leaders can present actionable insights that inform strategic decisions, identify market opportunities, and refine sales tactics. Ultimately, Clear Analytics empowers sales teams to make data-driven decisions that enhance their competitive edge in the marketplace.
Use cases What workflows benefit from using Clear Analytics for churn prediction in customer success teams?
Clear Analytics enhances churn prediction workflows for customer success teams by providing real-time data insights that allow for proactive engagement with at-risk customers. By leveraging advanced predictive analytics, teams can identify patterns and trends in customer behavior, enabling them to tailor retention strategies effectively. The Excel-based reporting simplifies data manipulation, allowing team members to quickly analyze customer segments and churn indicators without needing extensive IT support. This self-service capability empowers customer success teams to act swiftly on insights, improving customer satisfaction and reducing churn rates. Additionally, Clear Analytics integrates seamlessly with existing data sources, ensuring that teams have access to the most current information, which is crucial for making informed decisions that drive customer loyalty.
Use cases When should businesses adopt Clear Analytics for creating industry-specific dashboards?
Businesses should consider adopting Clear Analytics for creating industry-specific dashboards when they require a flexible, Excel-based solution that empowers users to generate customized reports without relying on IT. This is particularly beneficial for organizations that deal with large volumes of data and need real-time insights tailored to specific verticals or functions. Clear Analytics allows users to quickly integrate data from various sources, enabling them to create dashboards that reflect their unique business needs. Additionally, if a company is looking to enhance productivity by eliminating manual data preparation and reducing bottlenecks in reporting, Clear Analytics can significantly streamline these processes. By leveraging its self-service capabilities, businesses can foster a data-driven culture, allowing every user to become a "Power Analyst" and make informed decisions based on fresh, relevant data.
Alternatives What are the key differences between Clear Analytics and Power BI?
Clear Analytics and Power BI serve distinct yet complementary roles in the realm of business intelligence. Clear Analytics is primarily a self-service data consolidation and reporting tool that integrates seamlessly with Excel, allowing users to leverage Excel's native functions while enhancing data accessibility and collaboration without relying on IT. It empowers business users to create custom queries and generate reports directly within Excel. In contrast, Power BI is a robust analytics platform designed for data visualization and sharing insights across an organization. While Power BI excels in creating interactive dashboards and visual reports, Clear Analytics focuses on simplifying data manipulation and reporting for non-technical users. Together, they create a powerful analytics ecosystem, with Clear Analytics enhancing the Excel experience and Power BI providing advanced visualization capabilities.
Alternatives How does Clear Analytics compare to QlikView in terms of features?
Clear Analytics and QlikView both serve as powerful business intelligence tools, but they cater to different user needs and environments. Clear Analytics is an Excel-based self-service analytics solution that allows users to leverage familiar Excel functionalities while providing additional features that enhance data consolidation and reporting without the need for a data warehouse or specialized report developers. This can significantly reduce costs and streamline processes. In contrast, QlikView offers a more robust data visualization and dashboarding experience, focusing on associative data modeling and interactive analytics. While QlikView may require more training and setup, Clear Analytics emphasizes ease of use and quick deployment, making it ideal for organizations looking to empower users without extensive IT involvement. Ultimately, the choice between the two will depend on your specific reporting needs, user familiarity with Excel, and the complexity of data analysis required.
Alternatives What makes Tableau a better choice than Clear Analytics for data visualization?
Tableau is often considered a better choice than Clear Analytics for data visualization due to its advanced capabilities in creating interactive and visually appealing dashboards. Tableau offers a wide range of built-in visualization options and allows users to easily manipulate data through drag-and-drop functionality, making it suitable for complex data analysis. Additionally, Tableau's robust community and extensive resources provide users with support and inspiration for their projects. It also excels in handling large datasets and offers seamless integration with various data sources, enhancing its versatility. In contrast, Clear Analytics focuses on self-service analytics within Excel, which may limit its visualization capabilities compared to Tableau's more specialized tools. Ultimately, the choice depends on the specific needs of the organization, such as the complexity of data visualization required and the existing familiarity with Excel.
Alternatives In what ways does Looker outperform Clear Analytics for business intelligence?
Looker outperforms Clear Analytics in several key areas of business intelligence. Firstly, Looker offers a more robust data modeling layer, allowing users to create complex data relationships and custom metrics without extensive SQL knowledge, which can enhance analytical capabilities. Additionally, Looker provides a more comprehensive dashboarding experience with advanced visualization options and real-time data exploration, making it easier for users to derive insights quickly. Furthermore, Looker's integration with Google Cloud Platform enables seamless access to large datasets and powerful machine learning tools, which can be a significant advantage for organizations looking to leverage cloud-based analytics. In contrast, Clear Analytics focuses on Excel-based self-service analytics, which may limit its scalability and advanced analytical features compared to Looker's more sophisticated BI capabilities.
Alternatives What are the best alternatives to Clear Analytics for self-service data analytics?
When considering alternatives to Clear Analytics for self-service data analytics, several notable options stand out. Tableau is widely recognized for its powerful data visualization capabilities and user-friendly interface, making it a popular choice among businesses. Microsoft Power BI offers robust integration with other Microsoft products and is known for its affordability and ease of use. Qlik Sense provides a unique associative data model that allows users to explore data freely, while Alteryx excels in data preparation and advanced analytics. Additionally, Zoho Analytics is a cost-effective solution that offers a range of features for small to medium-sized businesses. Each of these tools has its strengths, so the best choice will depend on your specific business needs and existing technology stack.
Alternatives How does Clear Analytics stack up against MicroStrategy for enterprise reporting?
Clear Analytics and MicroStrategy both serve enterprise reporting needs but differ significantly in their approach and functionality. Clear Analytics is an Excel-based self-service analytics tool that leverages Power BI, allowing users to utilize familiar Excel functions while providing enhanced features for data consolidation and reporting. This eliminates the need for specialized report developers and reduces costs associated with data warehousing. In contrast, MicroStrategy is a more traditional BI platform that requires a steeper learning curve and often involves more complex setup and maintenance. While MicroStrategy offers robust analytics capabilities, Clear Analytics provides a more user-friendly experience, especially for organizations looking to empower non-technical users with self-service reporting. Ultimately, the choice between the two will depend on your organization's specific needs, budget, and user expertise.
Clear Analytics Competitors


Clear Analytics Features
- Low
- Medium
- High
| FEATURE | RATINGS AND REVIEWS |
|---|---|
| Analytics | Read Reviews (117) |
| Custom Reports | Read Reviews (166) |
| CAPABILITIES | RATINGS AND REVIEWS |
|---|---|
| Analytics | Read Reviews (117) |
| Custom Reports | Read Reviews (166) |
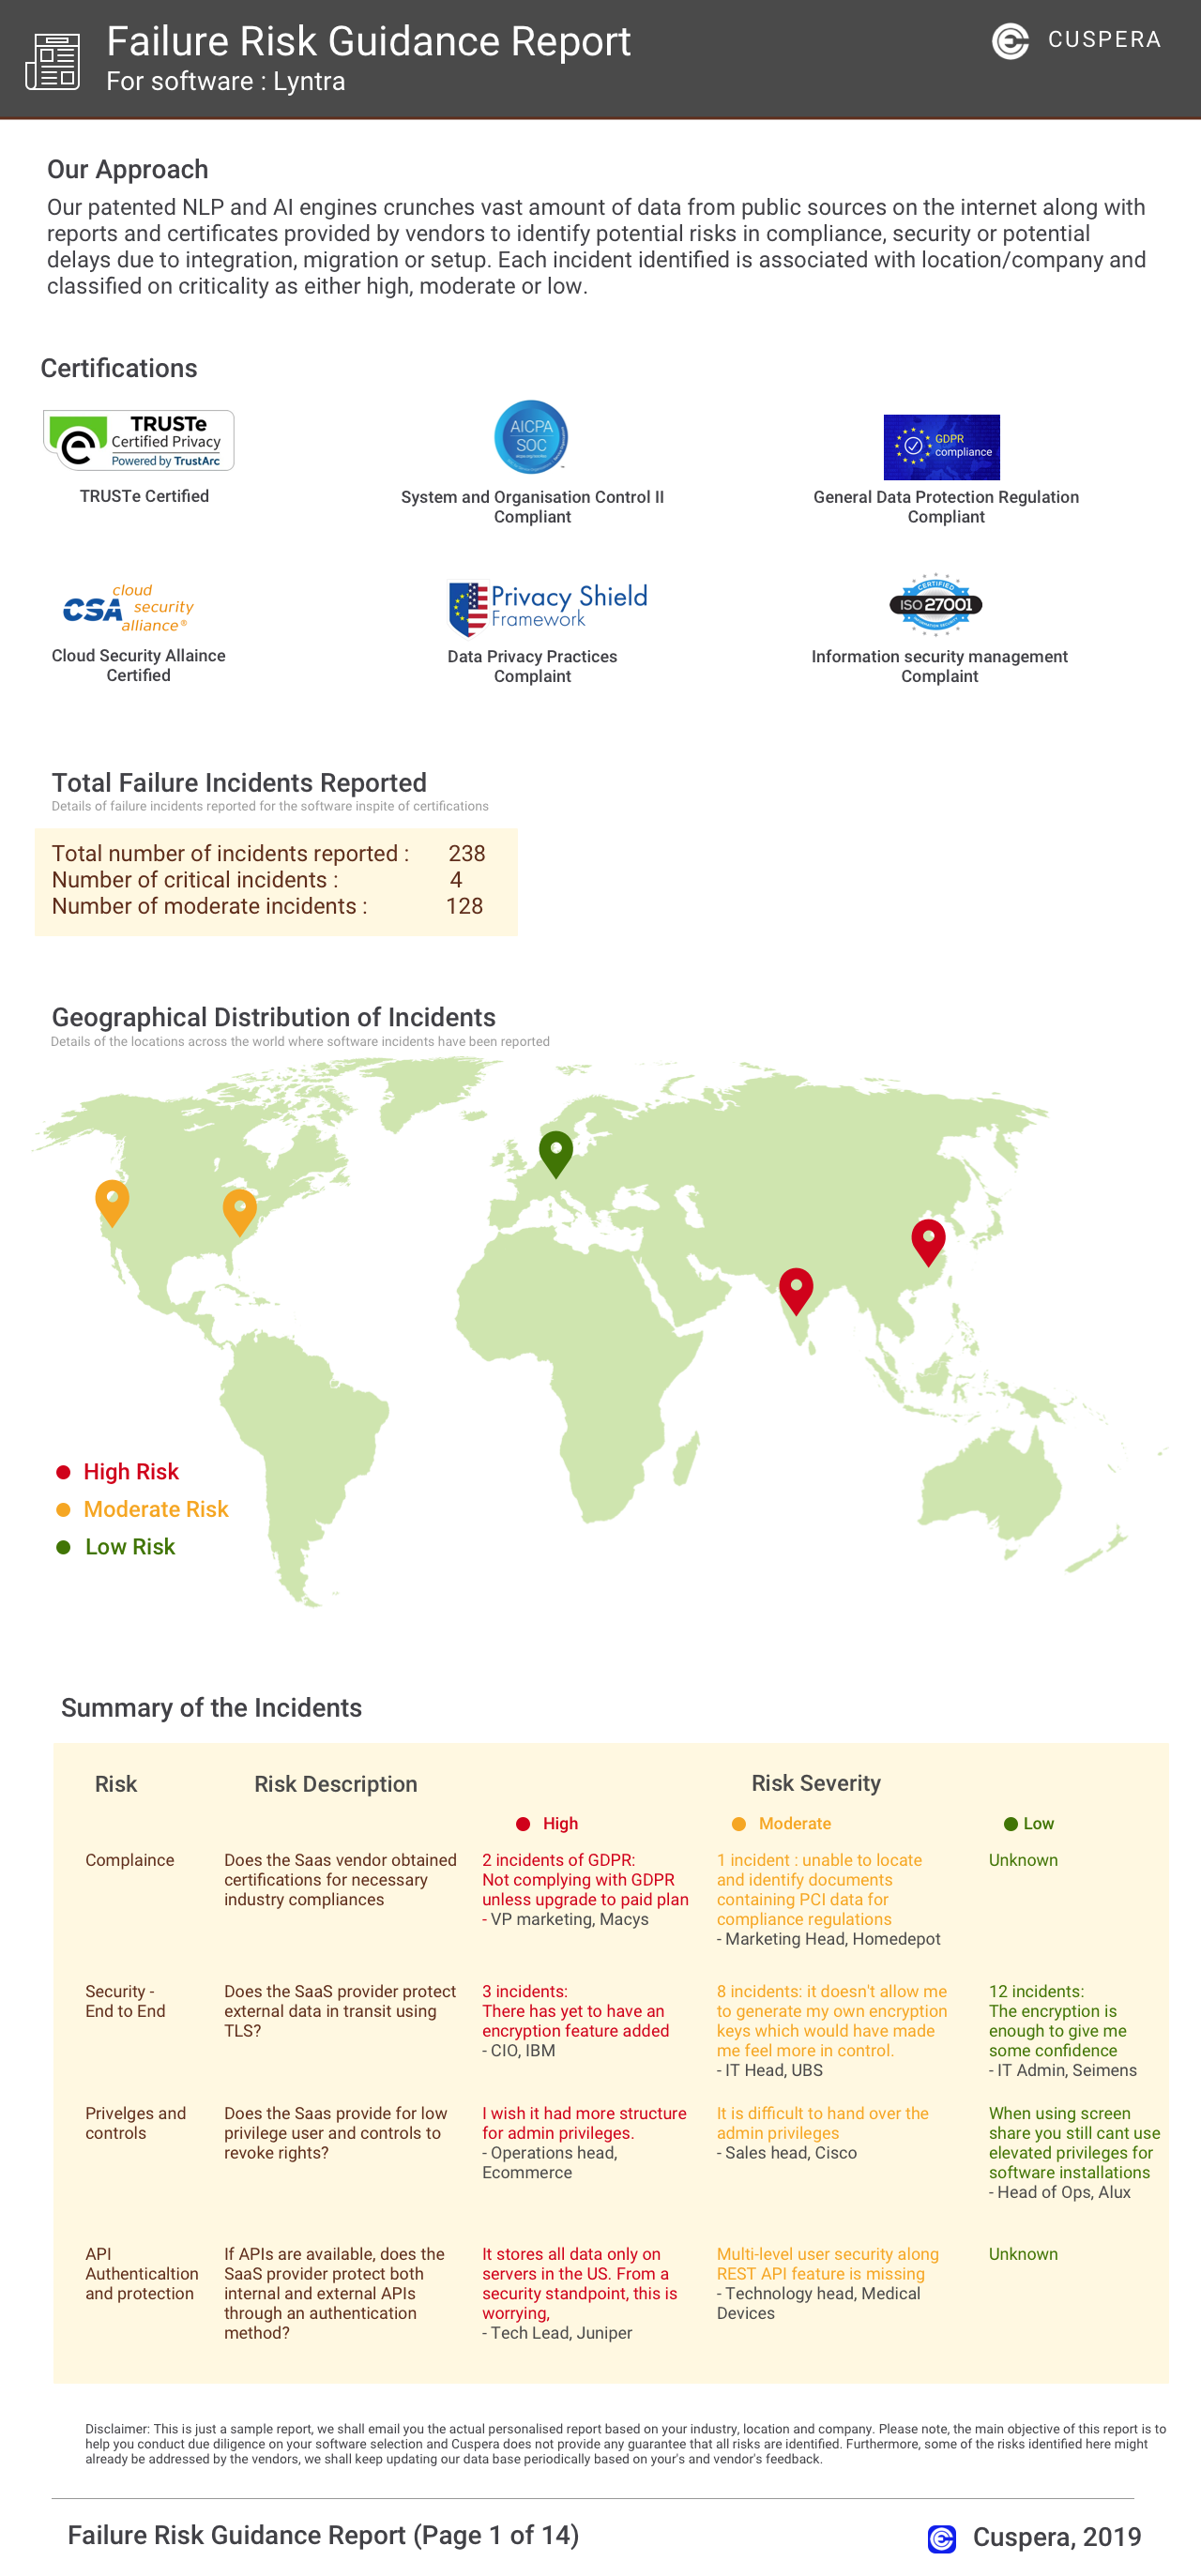
Software Failure Risk Guidance
?for Clear Analytics
Overall Risk Meter
Top Failure Risks for Clear Analytics
Clear Analytics BI Profile
HQ Location
172 Delancey Street, Suite 3D , New York, NY, 10002
Employees
1-10
Social


Financials
PRIVATE