Comparison Summary
This comparison report of CARTO Platform vs. Microsoft Power BI is based on a specific set of business needs and context. The comparison uses 18141 Cuspera insights based on peer reviews, case studies, testimonials, and expert opinions across 50+ sources.
Introducing CARTO Platform and Microsoft Power BI
CARTO Platform, Microsoft Power BI, Anylogic Simulation Software, Rapidminer, etc., belong to a category of solutions that help Business Intelligence. Different products excel in different areas, so the best platform for your business will depend on your specific needs and requirements.
CARTO Platform covers Workflow Management, Helpdesk Management, Funnel Analysis with Offline, Advertisement with Mobile, etc.
Microsoft Power BI focuses on Competitive Intelligence, Social Media Management, Communication Management with Website, Collaboration, etc.
"CARTO has significantly reduced the amount of time it takes for our team & other business users across Endesa to evaluate key factors in location planning and demand analysis. It is now much easier for us to quickly share insights with decision-make...rs, moving away from big and complicated Excel models that need a lot more explanation and slowed us down in our pursuit to grow our business. " - Oliver Reigosa Rubianes
"Teams ushered in an open communications model where everybody can present their ideas in an immediate and transparent way... Today, we arrive at better solutions, faster than we would have previously. " - Cory Smithson
Unsure which of these solutions is right for you? Our Cuspera AI engine can compare them based on your needs and specific to your industry and context. Get your personalized report today.

 Microsoft Power BI
Focus area
Microsoft Power BI is better than CARTO Platform for
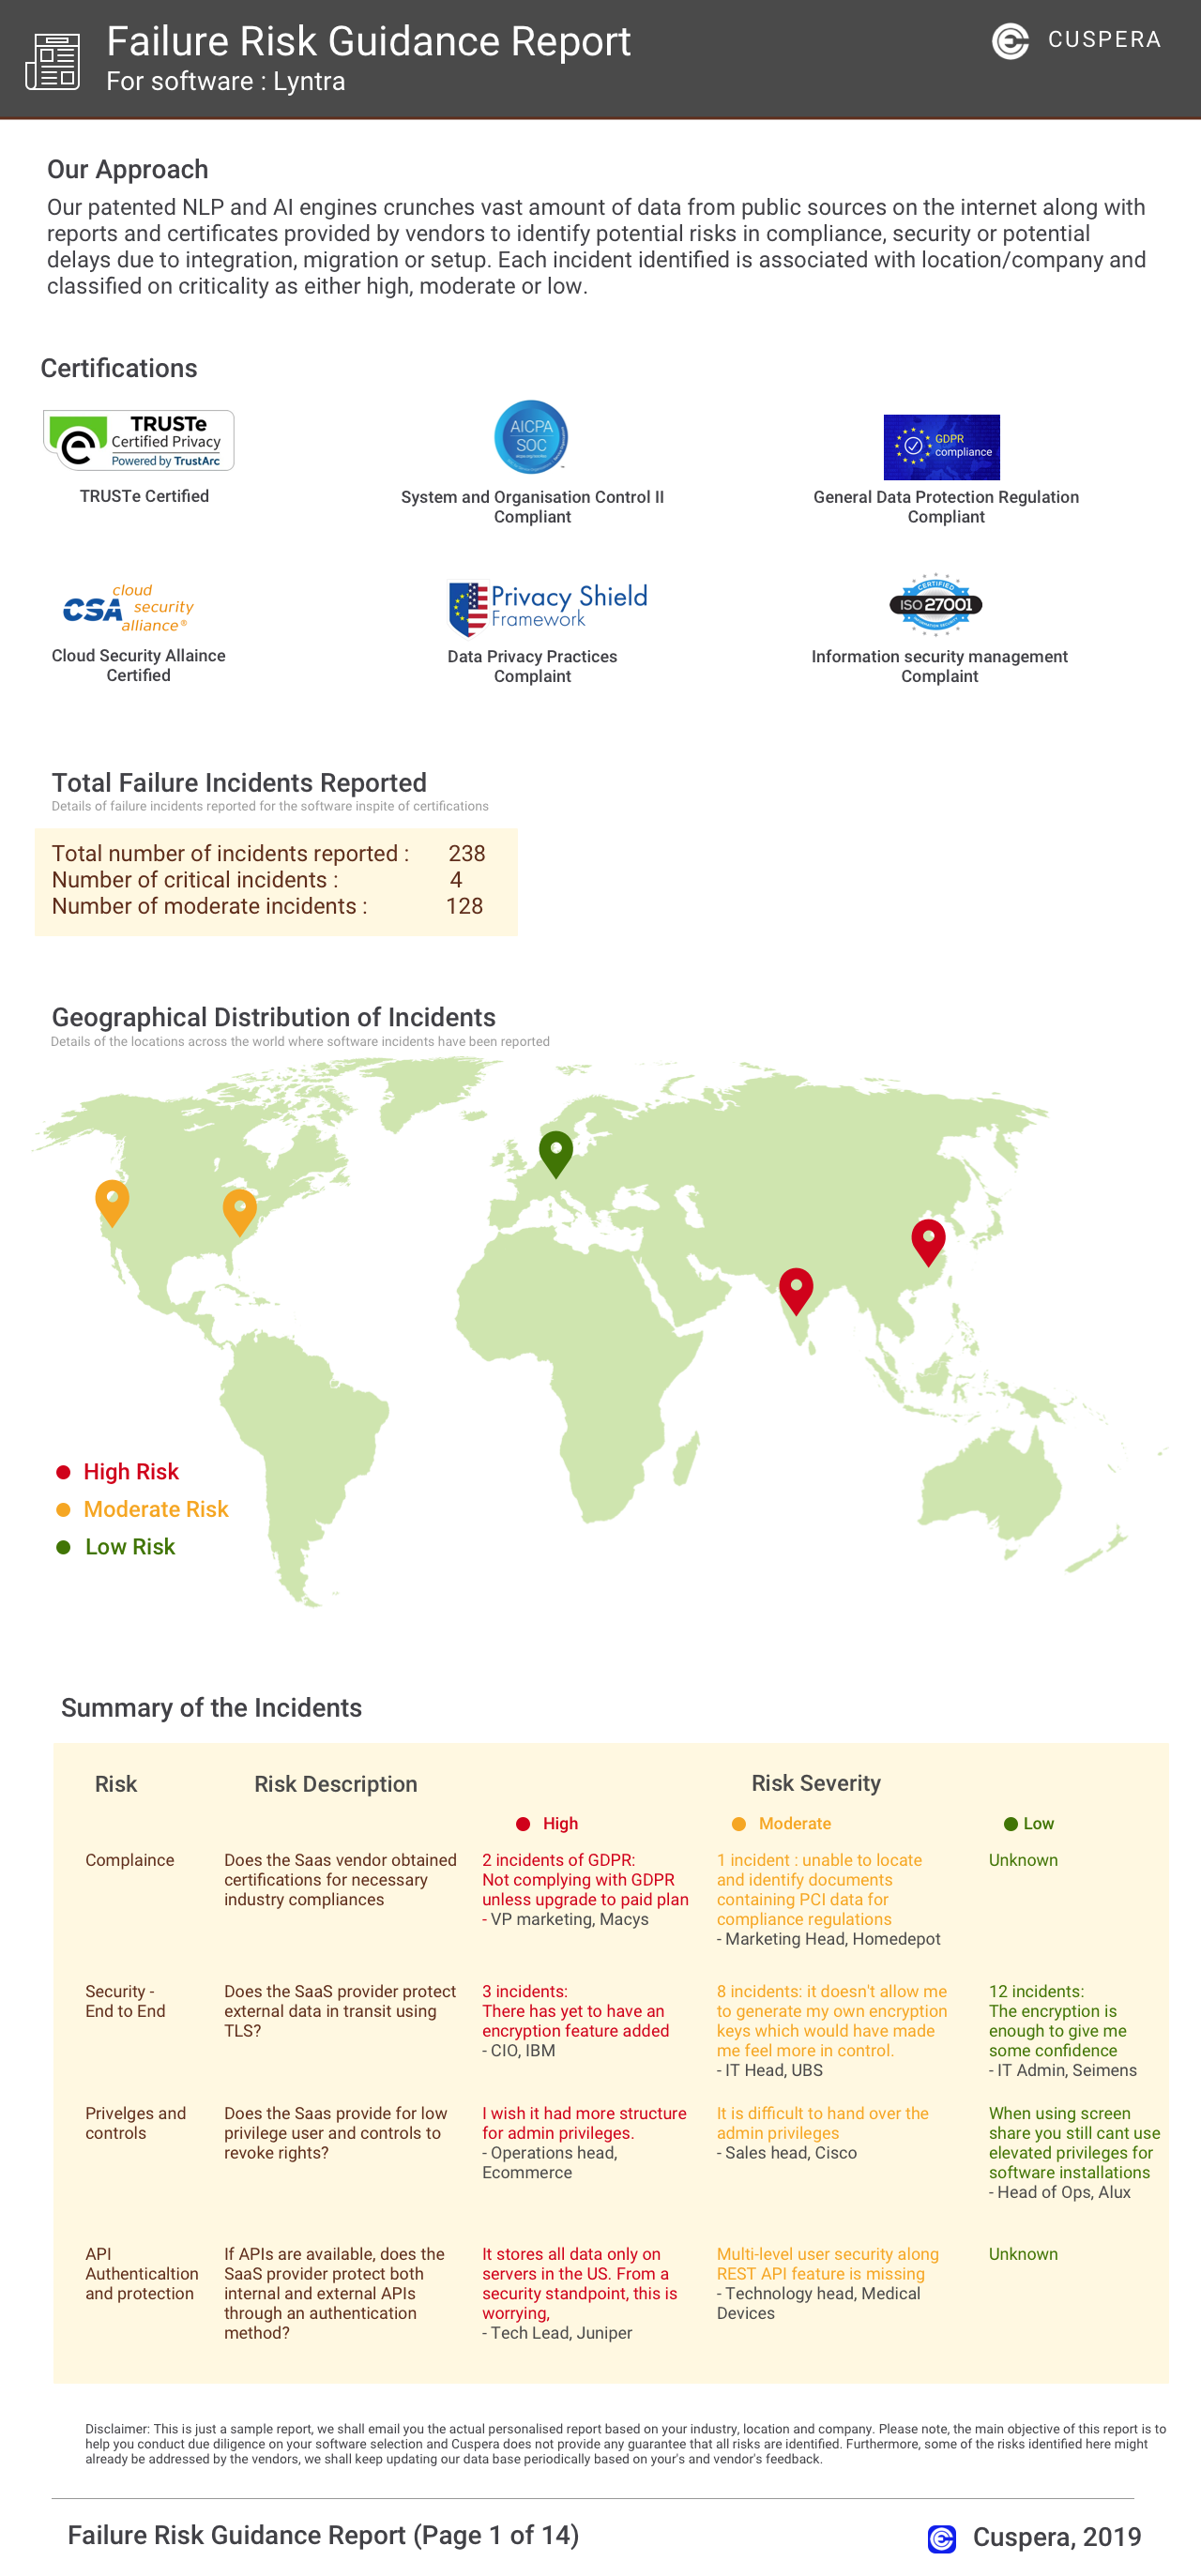
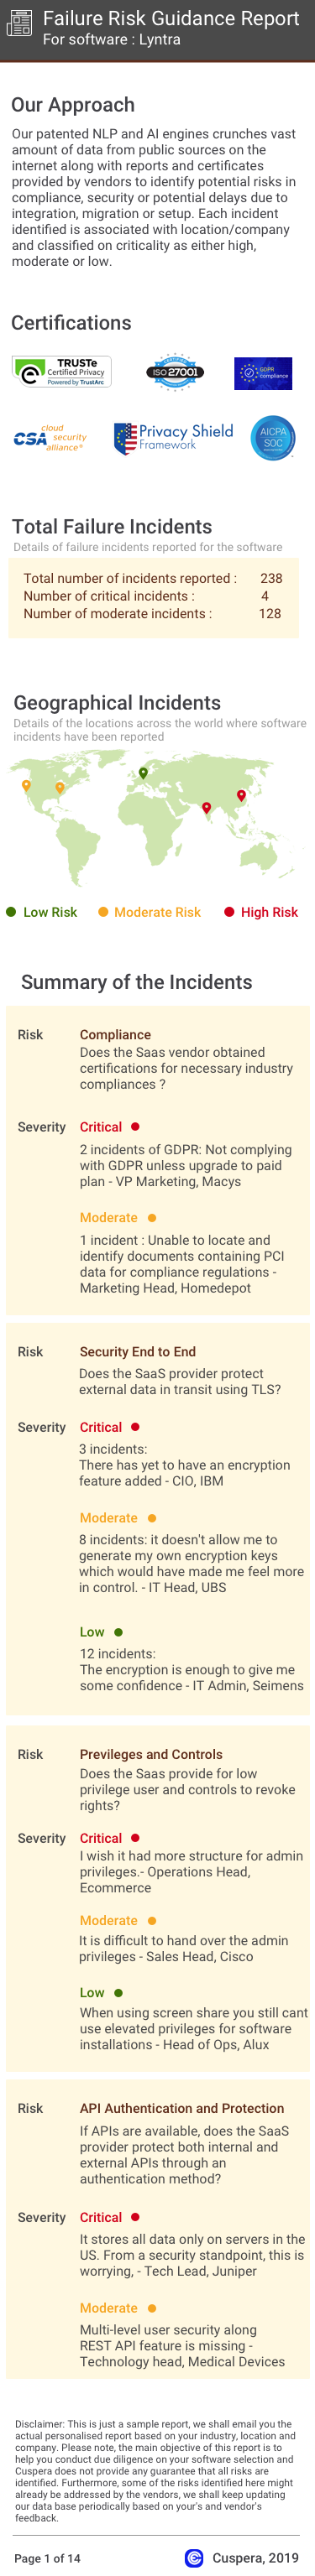
Software Failure Risk
About
Location Intelligence platform for Data Scientists, Developers and Analysts
Unify data from many sources to create interactive, immersive dashboards and reports that provide actionable insights and drive business results
Age
1975
Financials
SERIES C
IPO
Business Need
Total Processes
(we found evidences for)
42
90
Total Goals
(we found evidences for)
15
16
Top Processes
Evidences indicate better relative satisfaction
Top Goals
Goals Achieved
-
Acquire customers
-
Improve ROI
-
Increase sales & revenue
-
Grow market share
-
Enter new markets internationally or locally
-
Enhance customer relationships
-
Improve efficiency
-
Launch new products
-
Build brand awareness
-
Increase average basket value
-
Scale best practices
-
Improve navigation
-
Improve visibility
-
Improve internal communications
-
Improve digital and social presence
- See 12 more
-
Enhance customer relationships
-
Acquire customers
-
Increase sales & revenue
-
Scale best practices
-
Enter new markets internationally or locally
-
Improve internal communications
-
Improve ROI
-
Grow market share
-
Manage risk
-
Improve digital and social presence
-
Improve visibility
-
Improve efficiency
-
Improve stakeholder relations
-
Improve brand engagement
-
Establish thought leadership
-
Launch new products
- See 13 more
Top Channels
Channels Used
-
website
-
offline
-
mobile
-
phone calls
-
e-mail
-
social media
-
on premises
-
mass media
-
point of sale
-
video
-
chat
-
user generated content
-
blogs
-
Facebook
-
games
-
trade shows
-
Twitter
-
mobile app
-
Whatsapp
-
promotions
-
print media
-
newspaper
-
LinkedIn
- See 20 more
-
website
-
offline
-
mobile
-
phone calls
-
e-mail
-
social media
-
on premises
-
mass media
-
point of sale
-
video
-
chat
-
user generated content
-
blogs
-
Facebook
-
games
-
trade shows
-
Twitter
-
mobile app
-
Whatsapp
-
promotions
-
print media
-
newspaper
-
LinkedIn
- See 20 more
Failure Risk Guidance Security Report?
Compliance Risk
{{{rsh_C_1}}}
{{{rsh_C_1}}}
Security & Privacy Risk
{{{rsh_C_1}}}
{{{rsh_C_1}}}
Integration Risk
{{{rsh_C_1}}}
{{{rsh_C_1}}}
Migration Risk
{{{rsh_C_1}}}
{{{rsh_C_1}}}
IT and Other Capabilities
- Low
- Medium
- High