Comparison Summary
This comparison report of Google Analytics vs. Sprinklr Marketing is based on a specific set of business needs and context. The comparison uses 139596 Cuspera insights based on peer reviews, case studies, testimonials, and expert opinions across 50+ sources.
Introducing Google Analytics and Sprinklr Marketing
Google Analytics, Adobe Analytics, MonsterInsights, etc., belong to a category of solutions that help Digital Analytics, whereas Sprinklr Marketing belong to a category of solutions that help Search and Social Advertising. Different products excel in different areas, so the best platform for your business will depend on your specific needs and requirements.
Google Analytics covers Advertisement with Website, Social Media Management with Social Media, Engagement Management with Website, Campaign Management with Website, etc.
Sprinklr Marketing focuses on Advertisement with Social Media, Content Management with Social Media, Social Media Management with Social Media, Engagement Management with Social Media, etc.
"Google Analytics 4’s machine learning capabilities allow us to transform our digital advertising strategy efficiently and effectively by leveraging its out–of-the-box solution. " - Kai Tsang
"We use Sprinklr to position our CEO on a daily basis by listening to what people are saying about her. It also helps ensure we understand our audience when we’re building and promoting her presence. " - Vincent Colegrave
Unsure which of these solutions is right for you? Our Cuspera AI engine can compare them based on your needs and specific to your industry and context. Get your personalized report today.
 Google Analytics
Focus area
Google Analytics is better than Sprinklr Marketing for
Software Failure Risk
 Sprinklr Marketing
Focus area
Sprinklr Marketing is better than Google Analytics for
Software Failure Risk
About
Web analytics service that provides statistics and basic analytical tools
Unified omnichannel platform for the end-to-end marketing lifecycle
Age
2009
Financials
SERIES A
PRIVATE
Business Need
Total Processes
(we found evidences for)
145
41
Total Goals
(we found evidences for)
23
8
Top Processes
Evidences indicate better relative satisfaction
Top Goals
Goals Achieved
-
Acquire customers
-
Improve ROI
-
Enhance customer relationships
-
Increase sales & revenue
-
Improve digital and social presence
-
Improve efficiency
-
Grow market share
-
Build brand awareness
-
Scale best practices
-
Enter new markets internationally or locally
-
Increase customer life time value
-
Reduce bounce
-
Improve brand engagement
-
Launch new products
-
Improve internal communications
-
Establish thought leadership
-
Improve stakeholder relations
-
Manage risk
-
Improve visibility
-
Improve navigation
-
Shorten ramp up time
-
Increase average basket value
-
Improve consistency
- See 20 more
-
Improve ROI
-
Improve efficiency
-
Enhance customer relationships
-
Acquire customers
-
Build brand awareness
-
Improve digital and social presence
-
Scale best practices
-
Enter new markets internationally or locally
- See 5 more
Top Channels
Channels Used
-
social media
-
LinkedIn
-
Facebook
-
user generated content
-
phone calls
-
blogs
-
website
-
e-mail
-
offline
-
on premises
-
Instagram
-
Twitter
-
promotions
-
Pinterest
-
chat
-
Snapchat
- See 13 more
-
social media
-
LinkedIn
-
Facebook
-
user generated content
-
phone calls
-
blogs
-
website
-
e-mail
-
offline
-
on premises
-
Instagram
-
Twitter
-
promotions
-
Pinterest
-
chat
-
Snapchat
- See 13 more
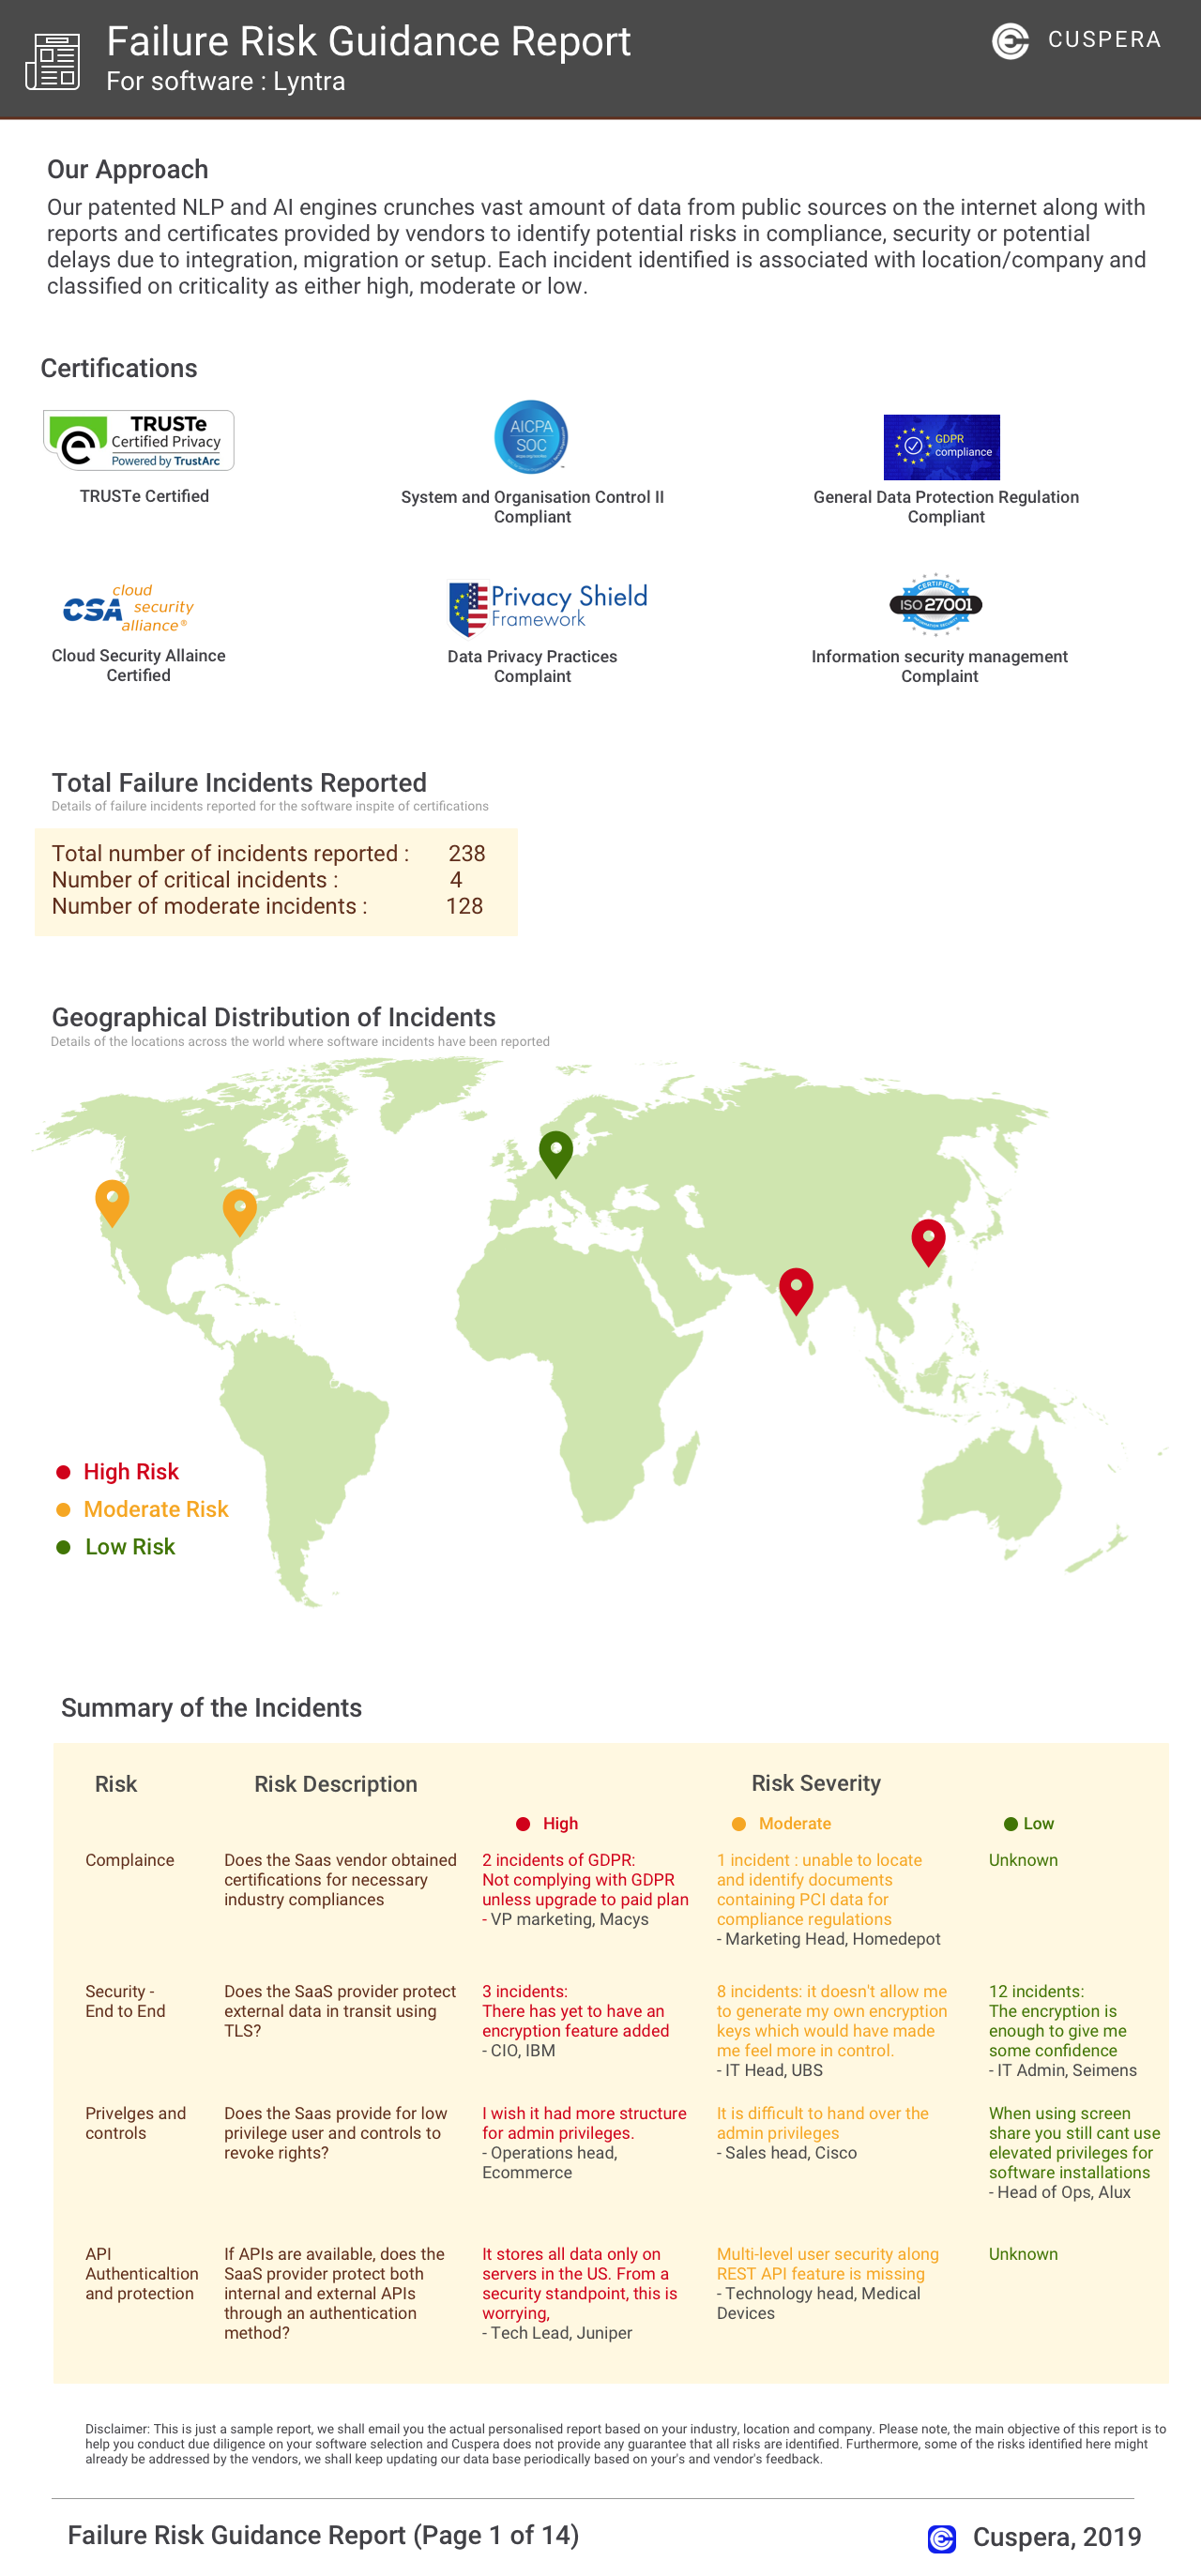
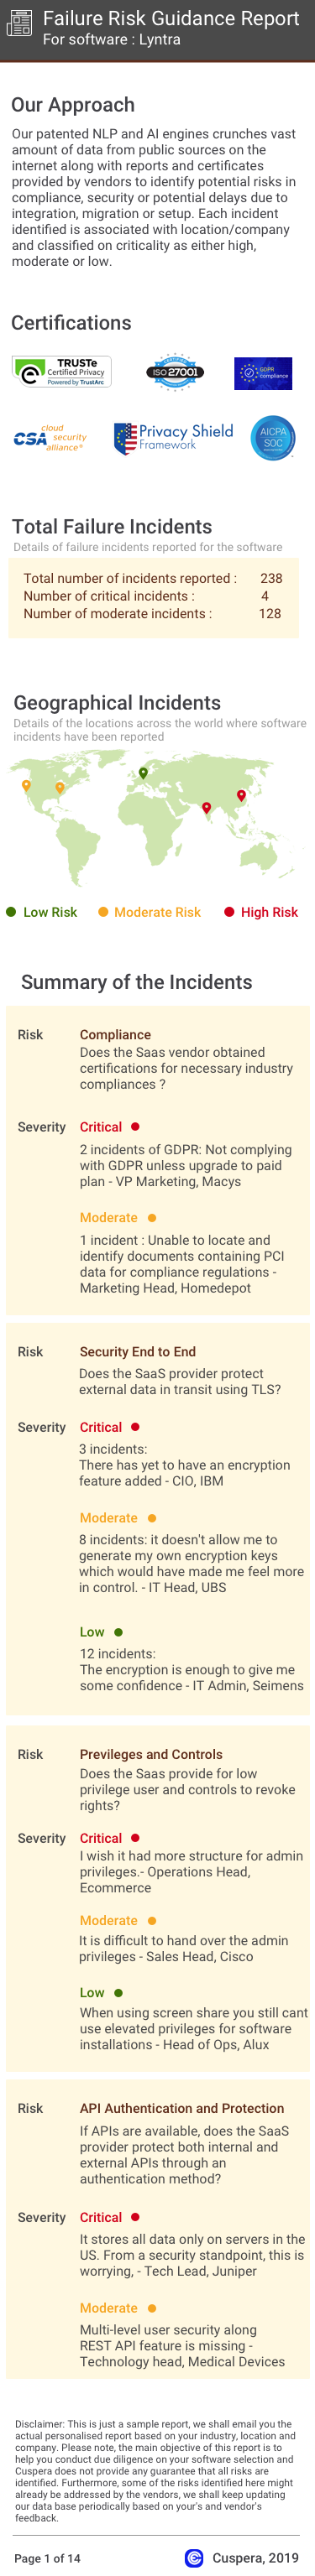
Failure Risk Guidance Security Report?
Compliance Risk
{{{rsh_C_1}}}
{{{rsh_C_1}}}
Security & Privacy Risk
{{{rsh_C_1}}}
{{{rsh_C_1}}}
Integration Risk
{{{rsh_C_1}}}
{{{rsh_C_1}}}
Migration Risk
{{{rsh_C_1}}}
{{{rsh_C_1}}}
IT and Other Capabilities
- Low
- Medium
- High